In the past week, Treasury bonds saw a large selloff as prices collapsed with foreign ownership T-bills in stark decline. All of it related to sky-high oil prices.
In a recent interview, U.S. Treasury Secretary Scott Bessent stated that to potentially alleviate economic concerns interest rates will likely come down once the U.S.-Iran conflict over the Strait of Hormuz is over.
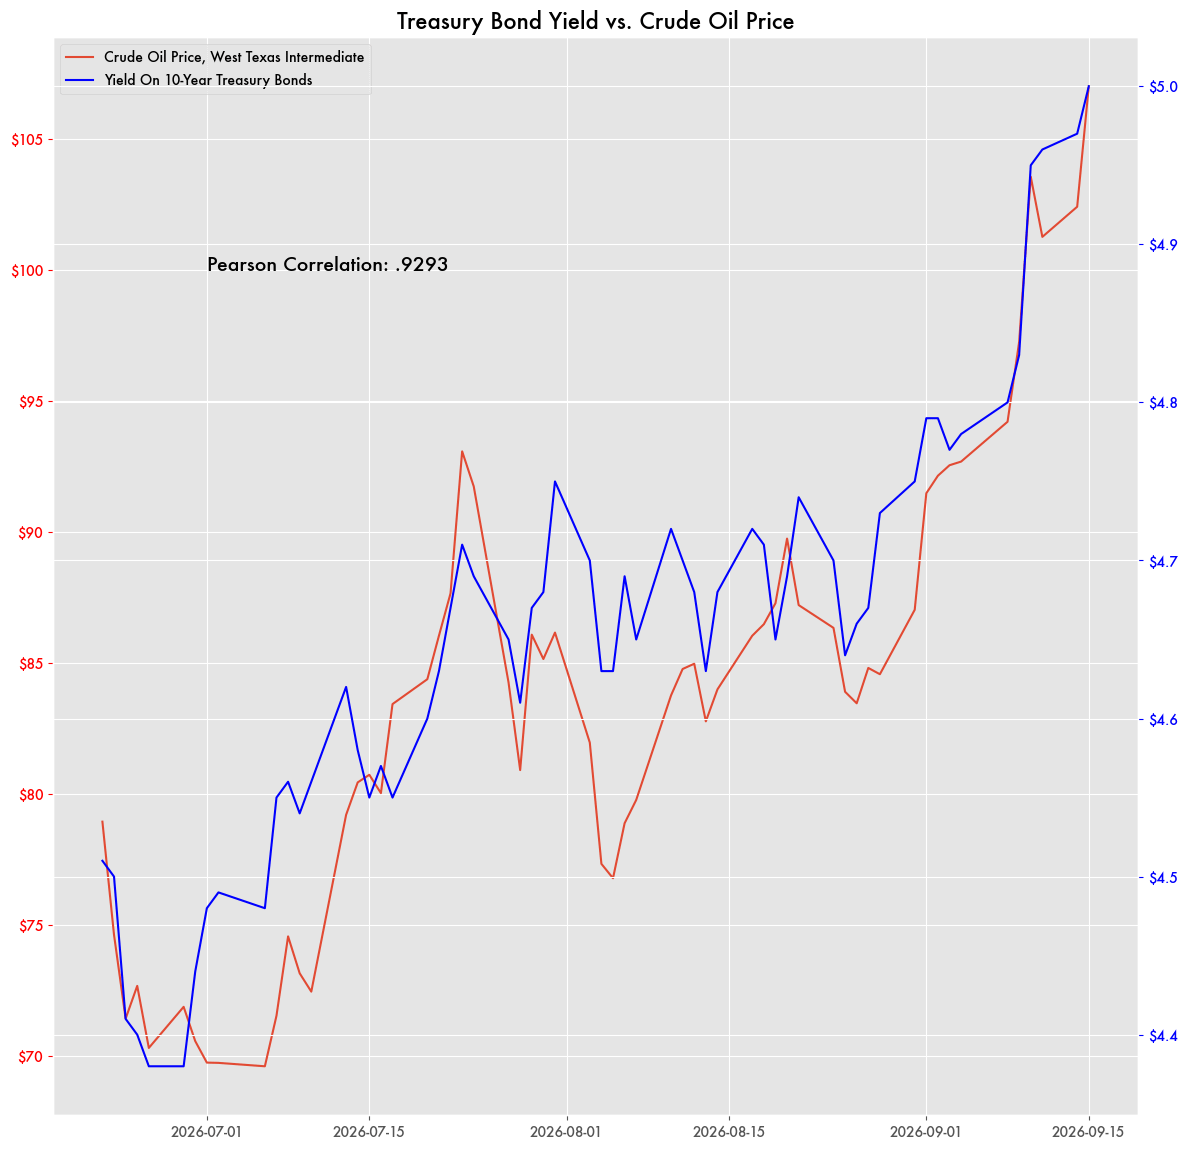
The conflict there has driven up oil prices over the last few months, which in turn has driven up the yield on Treasury bonds in sync.
The U.S. has had some of the highest correlations between Treasury rates and crude oil prices as the two prices have been intertwined. The monthly average price of West Texas Intermediate crude tracked the yield on the 10-year Treasury bond almost exactly, with a Pearson correlation of .9293.
The Treasury recently increased interest rates to combat the potential resulting inflation. The general assumption is that bond yields follow crude oil prices because they are an indicator of inflation. High oil and gas prices lead to higher costs of everything because so much of the economy relies on oil and gasoline products.
That, in turn, leads to cheaper value of Treasury bonds because inflation erodes the value of the bonds. Cheaper bonds lead to higher yields as the two values are inversely correlated.
But oil prices are not commonly an indicator of inflation. In general, oil prices rise with inflation over the course of a decade like any commodity does, but the connection is loose.
There may be times when they are in step. For example, during the pandemic oil prices crashed and then swung upward severely, and so did inflation. But there are plenty of times when they are not even close.
Previously Little Correlation Between Oil, Bonds, And Inflation
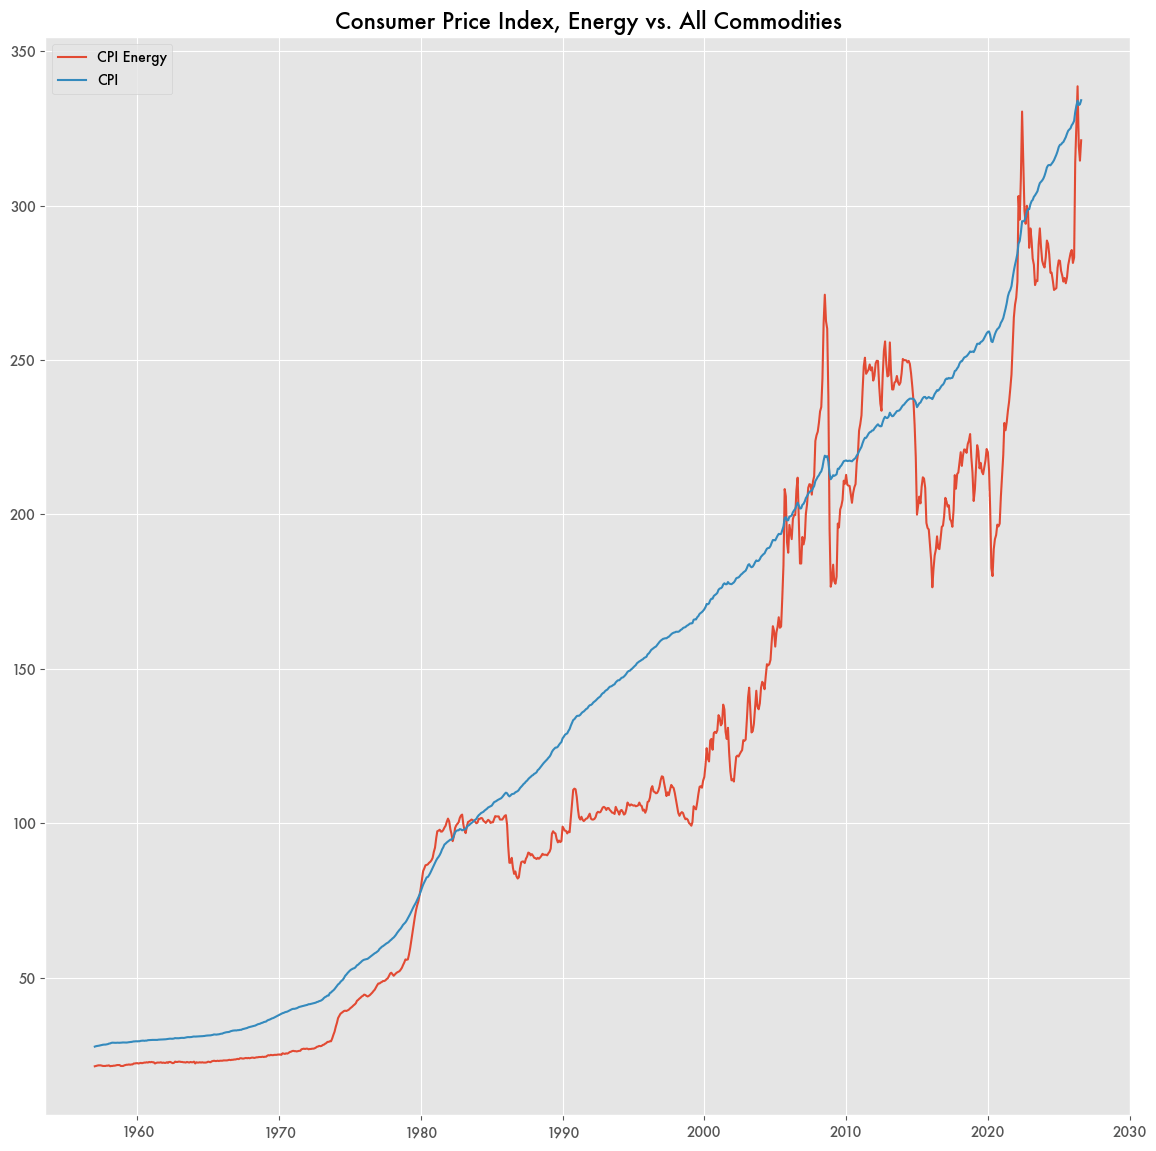
At other times oil prices can fluctuate wildly over the course of a year with no real substantial effect on inflation. Prior to the pandemic, inflation was relatively consistent for decades despite all kinds of oil price fluctuations.
For example, crude oil prices collapsed beginning in 2014, falling from over $105 per barrel to almost $30. Interest rates remained minimal throughout that time and inflation for 2014 through 2017 was about the same—1 to 2 percent. The one exception being 2015 where inflation was a low .1 percent.
In the early 2000s, energy prices grew significantly, doubling between 1999 and 2006. But inflation over that period was relatively consistent. In the early nineties, energy prices remained low while inflation was relatively consistent there too.
Inversion of Bond Yields
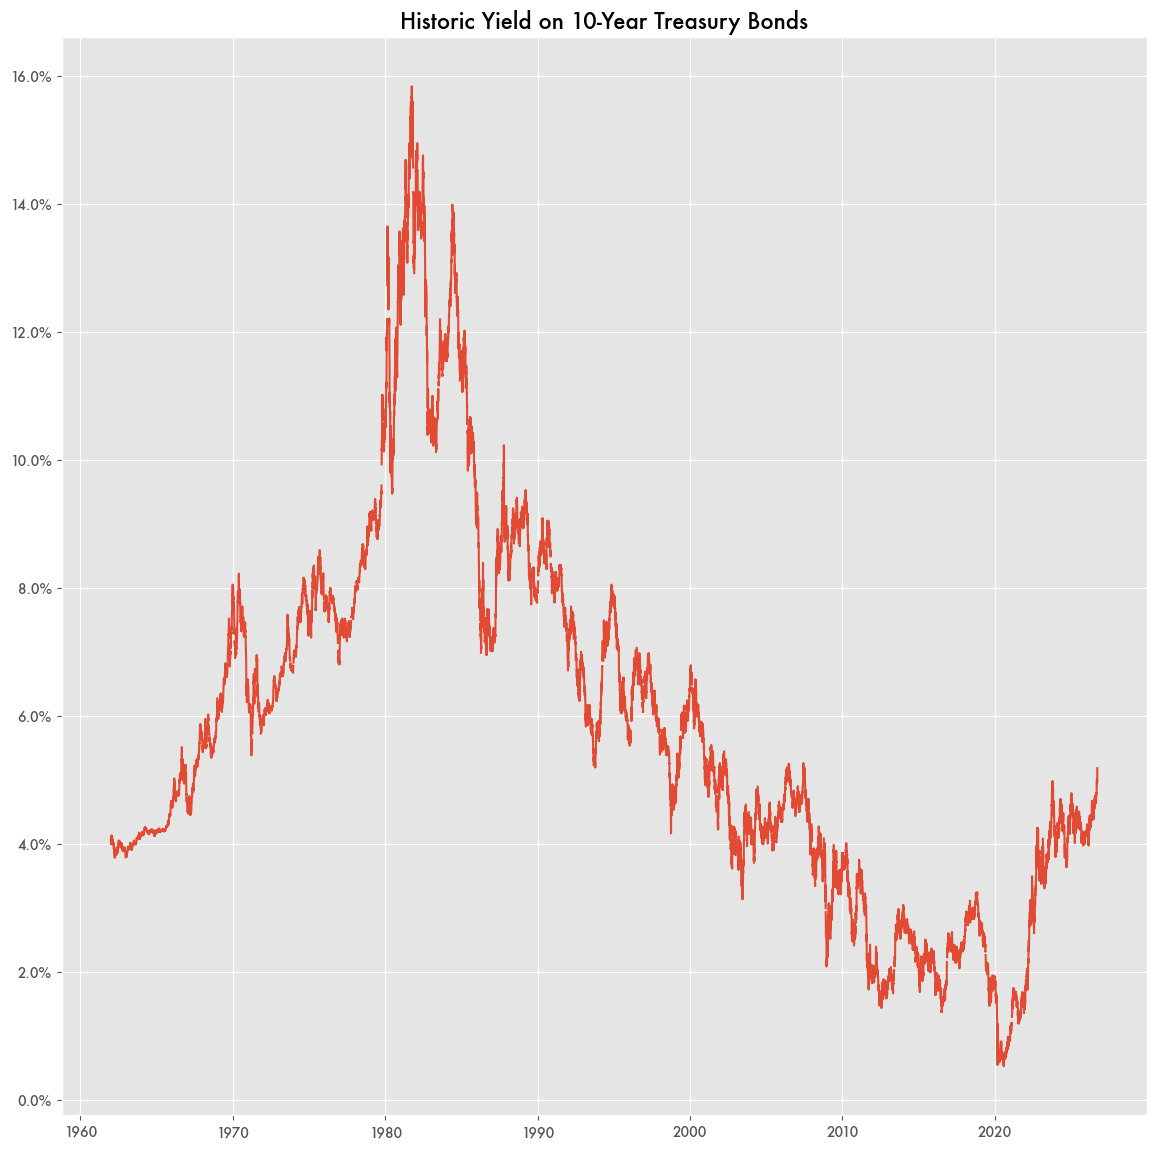
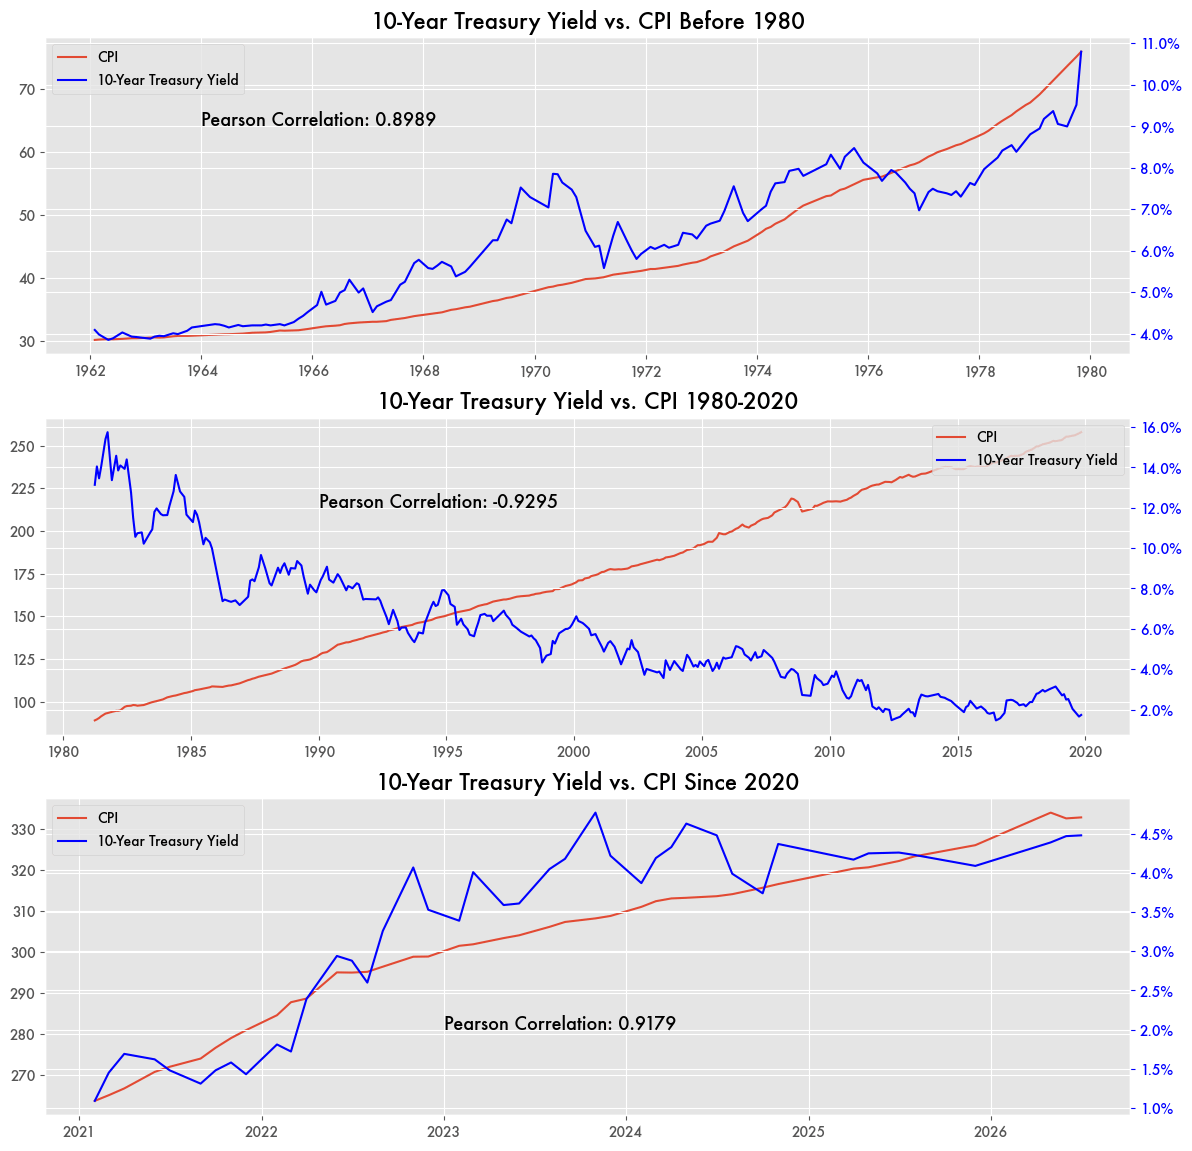
The correlation between Treasury yields and energy prices or inflation in general is something relatively new. Going back to the 1980s, 10-year Treasury bond yields were in steady decline despite oil prices generally rising across most of that time period. It’s only since around 2020 when that metric inverted.
Essentially, for forty years prior to the pandemic the average inflation was low. Treasury bonds were used more like stocks whose value is in their rising market price rather than as a long term investment based on interest payments until maturity.
If anything, the new regime of bond pricing is a reversion to what it was in the 1970s prior to the Volcker takeover of the Federal Reserve. Back then, oil shocks not only sent gasoline prices sky high, but also inflation and Treasury yields in tandem.
Why that happens now and in the 1970s but not in the years between is the subject of numerous economic papers with few concrete conclusions.