Collegiate Exam Scores Go Down as Grades Go Up
According to data from the Department of Education’s National Center for Education Statistics (NCES), average scores for the Scholastic Aptitude Test (SAT) and the American College Testing (ACT)—the standardized exams that college applicants complete for acceptance into undergraduate programs—have fallen in recent years.
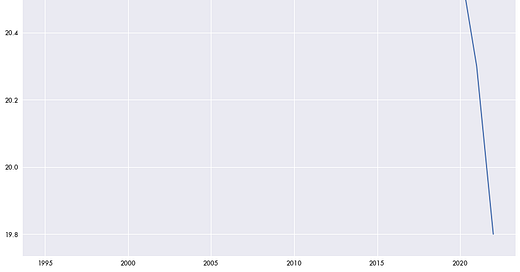
For the SATs, it’s been a steady decline since 2005. For the ACTs, it’s more recent—effectively since around the pandemic. What was once an average math SAT score of 520 is now 508. Reading scores were once around 508 and are now down to 494. ACT scores went from 20.8 to 21.0 to 19.8 in 2023.
Percentage-wise it’s not catastrophic—it’s a 2 percent and 5 percent fall respectively. But test results aren’t expected to decline in general. Prior to those downward swings, average scores were increasing.
Declining test scores contradict Department of Education data on average student grades in primary and secondary education, which have been slowly increasing over the last three decades. More and more students get mostly As and Bs than Cs, Ds, and Fs.
Grade Inflation or Something Else?
The discrepancy between weaker test scores and higher grades could possibly be a sign of grade inflation, where teachers are more likely to hand out higher and higher grades independent of the student’s abilities.
But there also might be issues with the data. Declining SAT and ACT scores contradicts other Department of Education data showing higher scores for college enrollees.
Since 2007, ACT scores for those entering college have consistently increased year over year across all subject tests (math, english, evidence-based reading and writing (ERW)) at the higher 75th percentile and the lower 25th percentile.
For SATs, it’s a little different as the test changed formats in 2016, skewing average scores around that time. SAT scores for college enrollees were largely flat before then and have since jumped up about 8 percent since.
Potentially schools are only accepting students with higher test scores for those that require it, or there could be issues with the Department of Education data.
Since 2008, the number of applications each school receives has almost doubled, and the number of admissions has almost doubled, yet the number of students enrolled hasn’t changed much. That is, schools are receiving more applications and accepting more students, but in the end the student body total isn’t changing. So colleges have a larger pool to choose from.
At the same time, some schools are being more exclusive—only accepting 10 or 25 percent of those that apply—while others are being more lax—accepting 75 or 90 percent of those that apply.
As a result, it’s the middle ground that’s disappearing. There are fewer and fewer schools accepting around 50 percent of applicants.
While the number taking the SAT exam is relatively constant, the percentage of students taking the ACT exam went from 56 percent in 2017 to 35 percent in 2021.
There’s also fewer schools submitting data. In 2008, the Department of Education data listed 4,025 contributing institutions. By 2021, it was down to 3,526, largely from a decline in reporting private institutions.


