How Much Did the Pandemic Affect Air Quality
One of the main drivers of air pollution is ozone. It’s a main factor in air quality index (AQI) measures and is considered to be severely detrimental to breathing. The American Lung Association considers it “one of the least well-controlled pollutants” and one of the most dangerous.
While not a direct product of emissions, ozone, also known as O3 or smog, is created when common air pollutants that result from the combustion of fossil fuels, like nitrogen oxides, mix with sunlight.
The risks associated with ozone and air pollution have driven increased Environmental Protection Agency (EPA) regulations on coal plants. As a result, coal consumption has dropped markedly in the last 20 years alongside declining ozone levels.
Yet the same trend doesn’t appear to have happened in any degree during the pandemic as gasoline consumption was halved. While coal might produce more ozone than gasoline per pound, such a large shift in consumption habits during the pandemic should ostensibly have led to some noticeable changes in air quality.
And while ozone levels have declined with declining coal consumption, there’s no guarantee that coal consumption was a major source. In areas where coal was phased out, air quality levels continued to decline for years after, and other areas that haven’t used coal for decades, like large parts of California, continue to have high ozone levels.
Little Gasoline Consumption During Pandemic
During the pandemic, the majority of the population stopped driving to work. In 2021, gasoline sales shrank to 10 million gallons a day, less than half of what it was in 2019 based on Energy Information Administration (EIA) data.
Yet ozone levels saw little change between 2019 and 2021 based on EPA data. Out of 953 metropolitan areas, the average change in ozone levels was a decline of around 1 part per billion.
Out of 953 metropolitan areas in EPA data, only 152 had a decline in ozone levels above the standard deviation; 148 cities saw an increase in ozone levels.
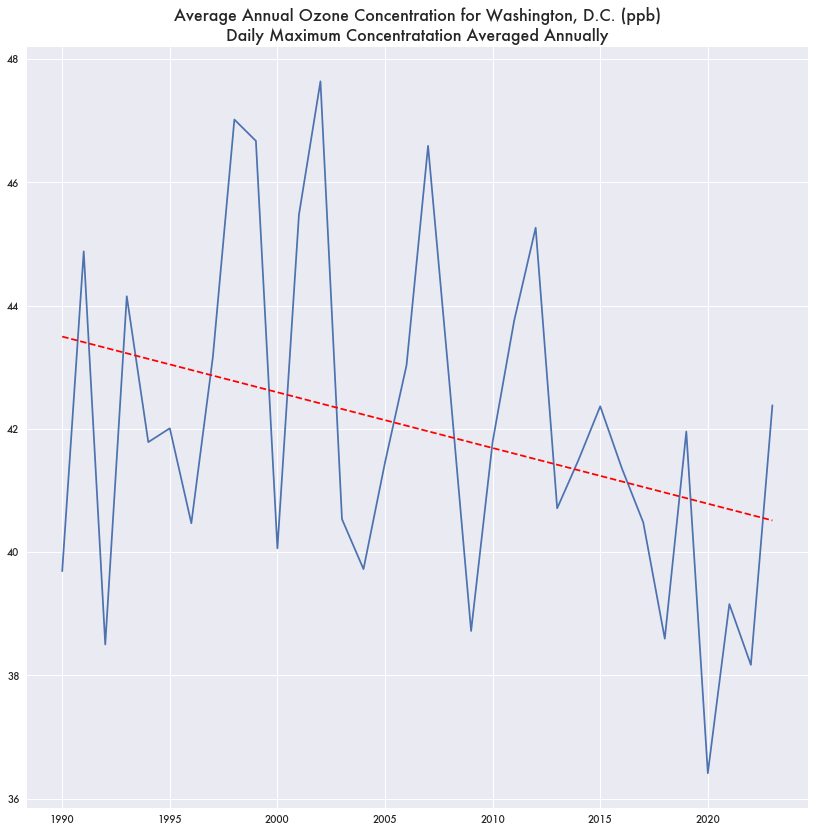
For Washington, D.C., the city experienced a larger decline in ozone the year before the pandemic, in 2019, despite no distinct reduction in fossil fuel consumption that year based on the EPA’s temperature-adjusted annual data.
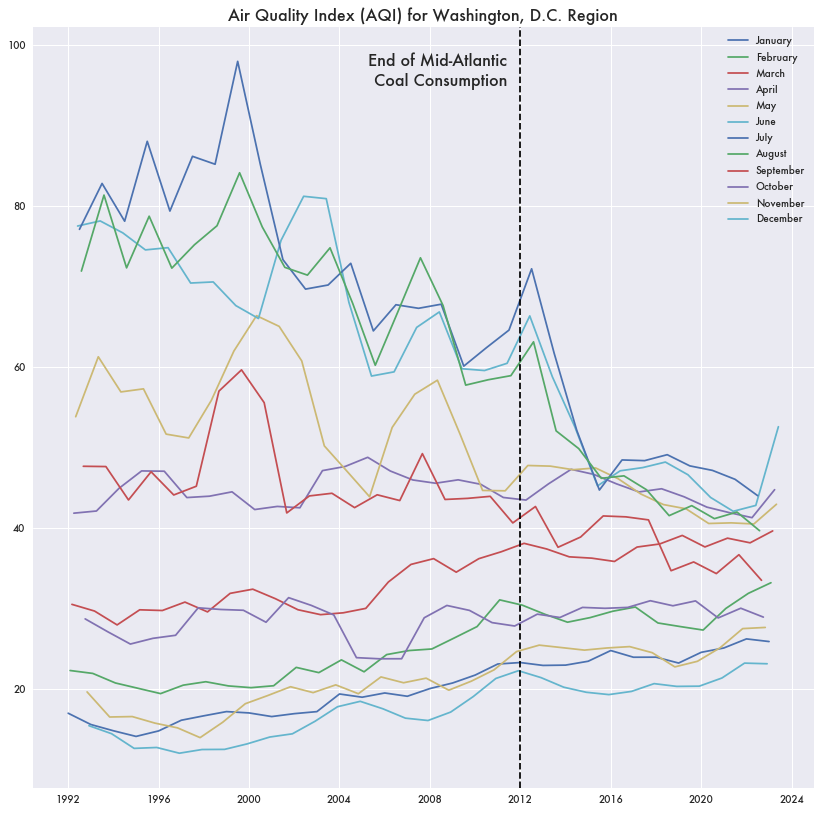
In general, the city has been seeing declines in ozone production year over year for the last twenty years even though regional coal consumption ended back in 2012.
Differences From Site-Level Data
Where a potential anomaly does show up for the pandemic is in the EPA’s raw site-level data.
Daily ozone concentration aggregated annually shows a distinct dip in 2020 where ozone levels hit historic lows of almost 36 parts per billion (ppb).
Los Angeles—maybe the biggest car-centric city in the country—would see little decline in ozone levels in 2020-2021 except at two monitoring sites: West Los Angeles and LAX Hastings.
Little Change in AQI or PM10
Not just ozone, but air quality index (AQI) measures saw no real change following the pandemic. Air quality during the summer months—when air quality is worse—had been steadily improving (going down) for years alongside the disappearance of coal consumption in D.C., which continued after coal plants stopped operating. Yet the large change in gasoline consumption didn’t seem to make a difference. Additionally, air quality for winter months has been steadily getting worse since the mid-90s.
A similar trend exists for particulate matter counts. In the D.C. area, PM10—a measure of larger particles in the air 10 microns or less—saw declining average values over the last twenty years that kept declining past the end of coal consumption but with little change during the pandemic and the absence of cars on the road. Cars are consider a substantial source of PM10, from exhaust, brake wear, and road surface wear.
In recent days, PM10 measurements shot up as smoke from the Canadian wildfires drifted into the D.C. area.
Other Air Quality Factors
While air quality measures appear to have improved at the same time as the decline in coal consumption and kept improving afterward, there is no certainty that coal plant or gas engine emissions are the source. Other factors including weather, climate, and geography can affect short-term and long-term air quality.
For example, Western states consistently rank highest for ozone levels independent of whether they have coal plants or not. Despite having no coal plants, Californian cities have the top 26 highest seasonal mean ozone levels for 2019, which includes not particularly dense or car-centric areas like Edison, California (ranked 10th).
The top eight states based on average ozone level for their cities are all West of the Mississippi—Utah, New Mexico, Arizona, Colorado, Nevada, California, Wyoming, and South Dakota.
While a city like D.C. has seen almost no ozone exceedance days in recent years—days where ozone levels exceed the EPA’s limits for health—places like Riverside, California and San Bernadino can have hundreds in a year.


