NASA Data Also Shows the Significant Rise in Solar Radiation
In 2003, the National Aeronautic and Space Administration (NASA) developed the Prediction of Worldwide Energy Resources (POWER) project to provide better meteorological data and understanding for renewable energy, sustainable buildings, and agroclimatology.
POWER takes in satellite observations of metrics like solar radiation and cloud cover to model surface solar insolation—estimates on solar radiation at the surface of the Earth.
From that data it’s apparent to see the significant growth in ultraviolet A (UVA) radiation over the last two decades—approximately .428 watts per meter-squared (W/m²) on average each year—a four and a half percent increase across twenty years.
Data is based off of NASA’s modeling from a single location at 35 degrees latitude, 150 degrees longitude—somewhere in the Pacific Ocean not far from Japan. While the POWER project collects cloud cover data, the UVA measurements are not adjusted for cloud cover so actual absorbed surface radiation would be lower.
While that number will vary considerably depending on where you are on the globe, an increase of almost half a W/m² is significant and would likely account for a noticeable increase in heat transfer as well.
A previous Investigative Economics story highlighted how model data from the National Renewable Energy Laboratory (NREL) showed growth in the average angle of solar incidence over the last two decades in the Northern hemisphere, which would lead to growth in solar heat transfer to the Earth.
Historic Research on Solar Radiation and Climate
Fluctuations in solar radiation have been linked to changes in climate for some time, with some associating a strong correlation between the two.
A 1923 research paper in the Bulletin of the American Meteorological Society detailed high correlations between radiation and climate measures—not just temperature, but also air pressure and rainfall—but they were not consistent with location:
Further investigation showed that with every increase of solar radiation, the pressure fell within the tropics and rose in the extra-tropical belt, especially in certain definite regions which vary with the time of the year.
Smoothed, overlapping ten-day means of solar radiation observed at Mount Wilson, Cal., in 1916 show a correlation with overlapping ten-day means of temperature at Sarmiento of —0.82 ± 0.03, perfect correlation being taken as 1.00.
That research details how a five percent change in the sun’s radiation would lead to around a six degree change in temperature, usually with a delay of around five days from the precipitating solar event.
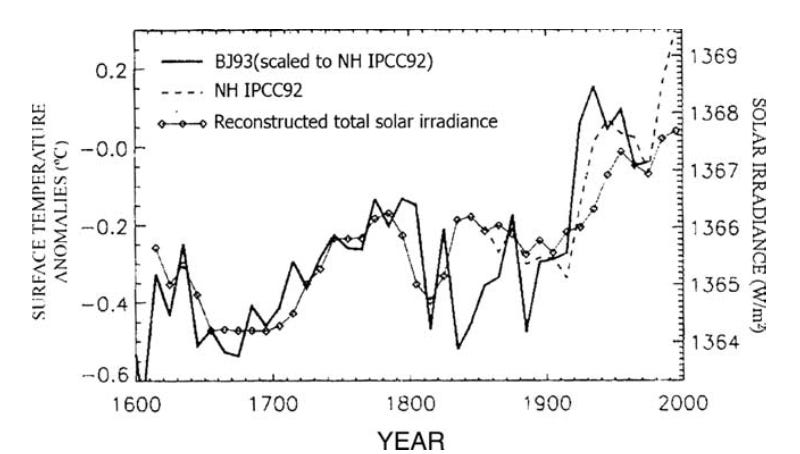
Another paper from 2011 in Geophysical Research Letters shows the correlation between solar irradiance and temperature in Japan to be even stronger:
The correlation between the averaged reconstructed March temperature record for Kyoto, Japan, and the reconstructed Total Solar Irradiance (TSI) over 660 years from 1230 to 1890 gives evidence with 98% probability that the Little Ice Age with four cold periods is forced by variations of TSI.
More recent research has highlighted the strong correlations between the two, such as that by Blanca Mendoza in 2003 in Advances in Space Research, including the longer time-scale correlation between irradiance and temperature.
That research notes only a .1 percent change in irradiance over the prior twenty years and only around .24 W/m² in heat difference in total in the low atmosphere. Since 1900, it’s around 3 W/m² growth.
While the NASA data is based on surface irradiance rather than the top of the terrestrial atmosphere, the NASA data shows around four times the average increase in the twenty years after that research was published (Δ .428 W/m² or 4.5 percent growth in last 20 years).
Difference From SORCE Data
The Solar Radiation and Climate Experiment (SORCE)—another NASA project in conjunction with the University of Colorado and others from 2003—used satellite data to measure solar radiance fluctuations outside of the Earth’s atmosphere. Data from that showed overall growth in solar radiation since 1900, but at a much smaller level—around 1 W/m² over 100 years—less than Mendoza’s research and much less than what the NASA POWER data shows.
Potential Unreliability of Some SORCE Data
The SORCE project also provides data on surface radiance (rather than outside the atmosphere) for select cities, but the data appears unreliable. It only shows a handful of fixed values of radiation in a year that are rotated through with no variance.
Based on SORCE’s own satellite data, there are various daily, monthly, and yearly random fluctuations in solar radiance—from sunspots and solar storms—that should also make their way down to surface level measurements.


