The Flood of Active Warrants in Washington, D.C.
As part of Operation Trident, Washington, D.C. police recently arrested 48 people with outstanding warrants as part of a campaign to focus on repeat offenders, particularly related to gun crime.
Back in September of 2016, a blog post from the D.C. Office of the Attorney General (OAG) noted there were 12,000 active warrants at the time for those charged with “non-violent felonies, misdemeanors and parole, probation, pretrial, or supervised release violations in the District of Columbia.” The office was encouraging those with outstanding warrants to safely turn themselves in to the police during a D.C. Safe Surrender program.
Seven years later, the D.C. courts site now lists around half that number of warrants for all possible crimes—both felonies and misdemeanors—meaning that at least 5,681 active warrants were fulfilled or dropped.
Update: A 2021 Department of Justice Annual Report shows that many of those outstanding warrants were dismissed (3,018):
“In connection with a Safe Surrender program launched by D.C. Superior Court, the D.C. United States Attorney’s Office, after assessing case viability, dismissed a significant number of older misdemeanor cases where bench warrants had been pending for multiple years.”
But what’s interesting is that 17 percent of the current active warrants came solely from cases brought between 2016 and 2018.
Over 400 active warrants are from 2016 cases alone—almost four times the pre-2015 average of 114 a year—only to swiftly drop off after that. Reported crime and prosecution data showed no significant increase in crime or arrests around that time.
It’s as if the criminal justice system discovered a huge backlog of warrants along with hundreds of new violations deserving warrants, and then declined to prosecute thousands of them.
Declining Prosecution Rates
Just prior to the large swell and purge of active warrants in 2016 is when both attorneys’ offices in D.C.—the OAG (run by the city) and the the U.S. Attorneys’ Office for D.C. (USAODC, run by the federal government and prosecutes cases in D.C.’s Superior Court), would see turnover in their attorneys general.
Karl Racine would take over the OAG from Irvin Nathan (2011-2015), and Channing Phillips would take over the USAODC from Ronald Machen (2010-2015). Vincent Cohen Jr. would hold the office of USAODC for a few months in 2015 as interim attorney general.
A previous Investigative Economics story showed that prosecution rates had been in decline going back to 2013, and now the USAODC only prosecutes about two-thirds of arrests. For property crime cases, the decline began in 2011.
Documents released under the Freedom of Information Act would also reveal a stark drop in homicide and aggravated assault conviction rates around 2015, but strangely that drop does not appear in annual reports from the attorney general’s office.
USAODC had blamed the declining prosecution rates on body-worn cameras and a lack of a certified forensic lab—but neither of which was an issue until after 2016.
Sudden Rise in Homicides
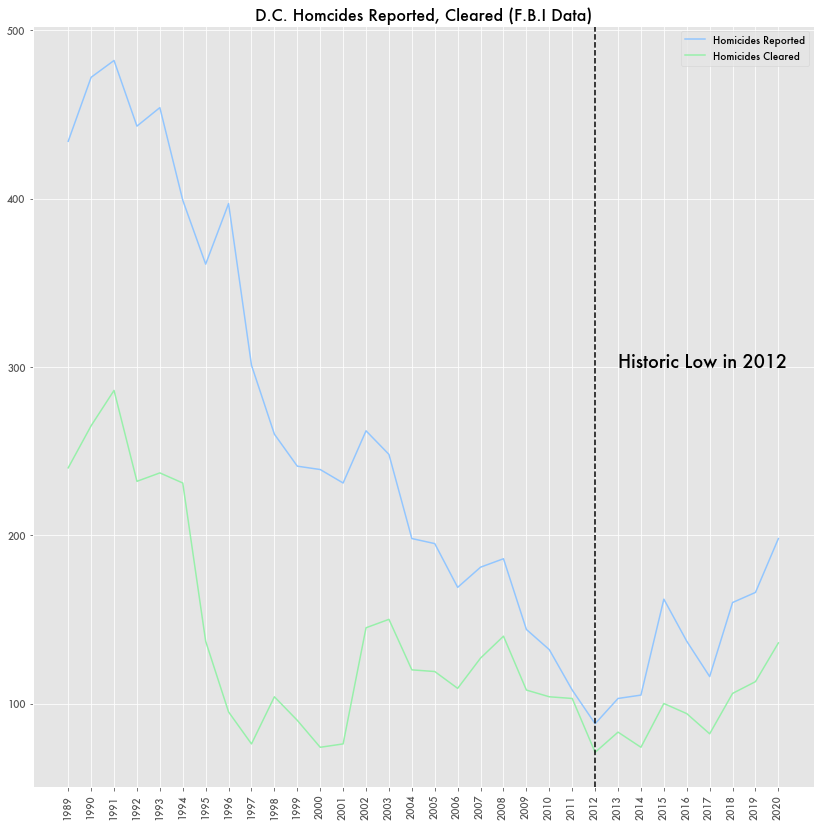
One other oddity during that time period is that homicides suddenly began increasing in 2013 after years and years of steady declines according to Federal Bureau of Investigation data.


Mr. Machen, along with his predecessors and successors, held the position of "United States Attorney for the District of Columbia" in the "United States Attorney's Office for the District of Columbia." I suggest you fix the label in the second and third charts, plus text in the seventh and eighth paragraphs.
I also wonder what the focus on Machen's term is. We've had six acting or permanent USAOs serving in that office since Machen left office nearly a decade ago (Phillips served in both official and acting capacities). Three of those seven were in office for longer than a year (Phillips for 23 months permanent from 2015 to 2017 plus eight more acting in 2021; Liu for 28 months; and Graves for 23 months and counting). Are there meaningful trends in that period?
On the first chart, is that really 'active warrants by year of case'?? Meaning today, we have ~150/175 active warrants outstanding from cases filed in 1978? Or is it warrants issued by **DC Superior Court** by year of issuance (i.e. excludes District Court warrants)? The presentation of this as a line graph is a little confusing because--I'm guessing?-- the total number of active warrants at a point in time is really the area under the curve (integral). Maybe a pie chart or stacked bar chart would present the disaggregation of current warrants outstanding by year of issuance a little more clearly.