Numerous studies have analyzed the effect of voter identification on election turnout only to come away with the same conclusion: it’s negligible. Some say it is inconclusive or slightly negative, others say it somehow correlates to higher turnout.
A 2019 Stanford paper showed little discernible effect:
We find that the voter ID law did deter those without identification from voting. And we find this effect is small enough that studies of aggregate turnout would be unable to detect it.
A 2015 Government Accountability Office (GAO) report found some decline in a few states, but it wasn’t much—at most 3.2 percentage points:
GAO found that turnout among eligible and registered voters declined more in Kansas and Tennessee than it declined in comparison states—by an estimated 1.9 to 2.2 percentage points more in Kansas and 2.2 to 3.2 percentage points more in Tennessee
A meta-analysis by the Massachusetts Institute of Technology (MIT) found that the effect of voter ID laws on turnout as “unclear.” A University of California at Davis paper found only “modest turnout effects and only minor differences across politically relevant groups.”
None of those conclusions align with the ongoing and contentious political debate over voter identification. Depending on which side you are on, either millions are illegally voting or millions of legitimate voters will be disenfranchised by the requirement of presenting an ID.
Somehow a change with negligible effects has been the heart of numerous lawsuits from groups like the American Civil Liberties Union (ACLU) and Supreme Court decisions at both the state and national level, and it currently surrounds the debate on the SAVE America Act.
Following a recent speech by President Trump on voting integrity, the Department of Homeland Security released a memo showing that “400,000 deceased registrants and over 28,000 non-citizens who illegally registered to vote”—two examples of populations that would likely be prevented from voting with an ID restriction.
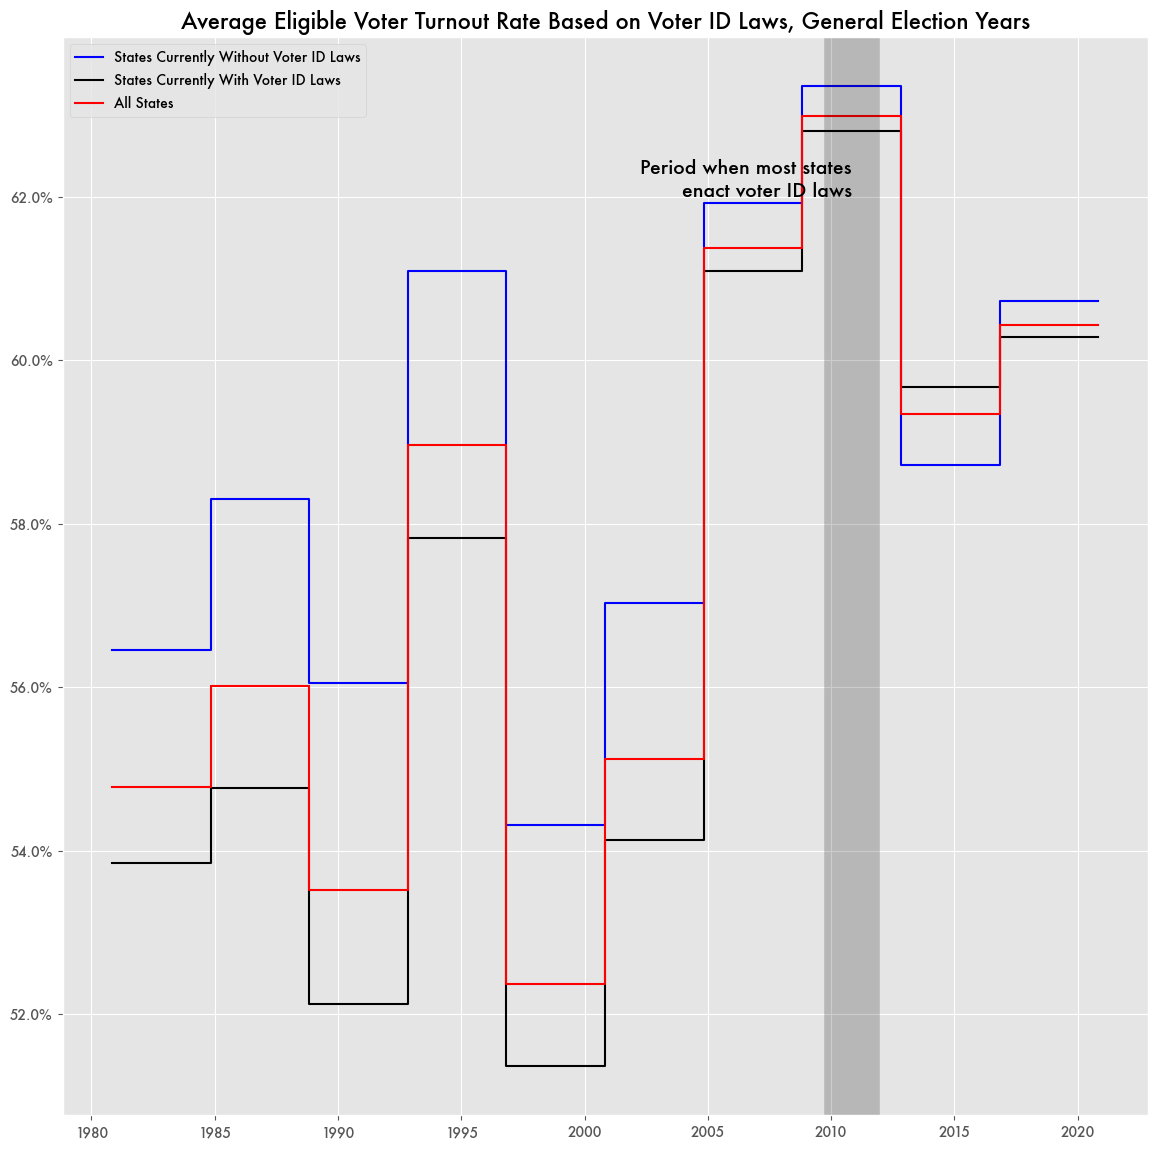
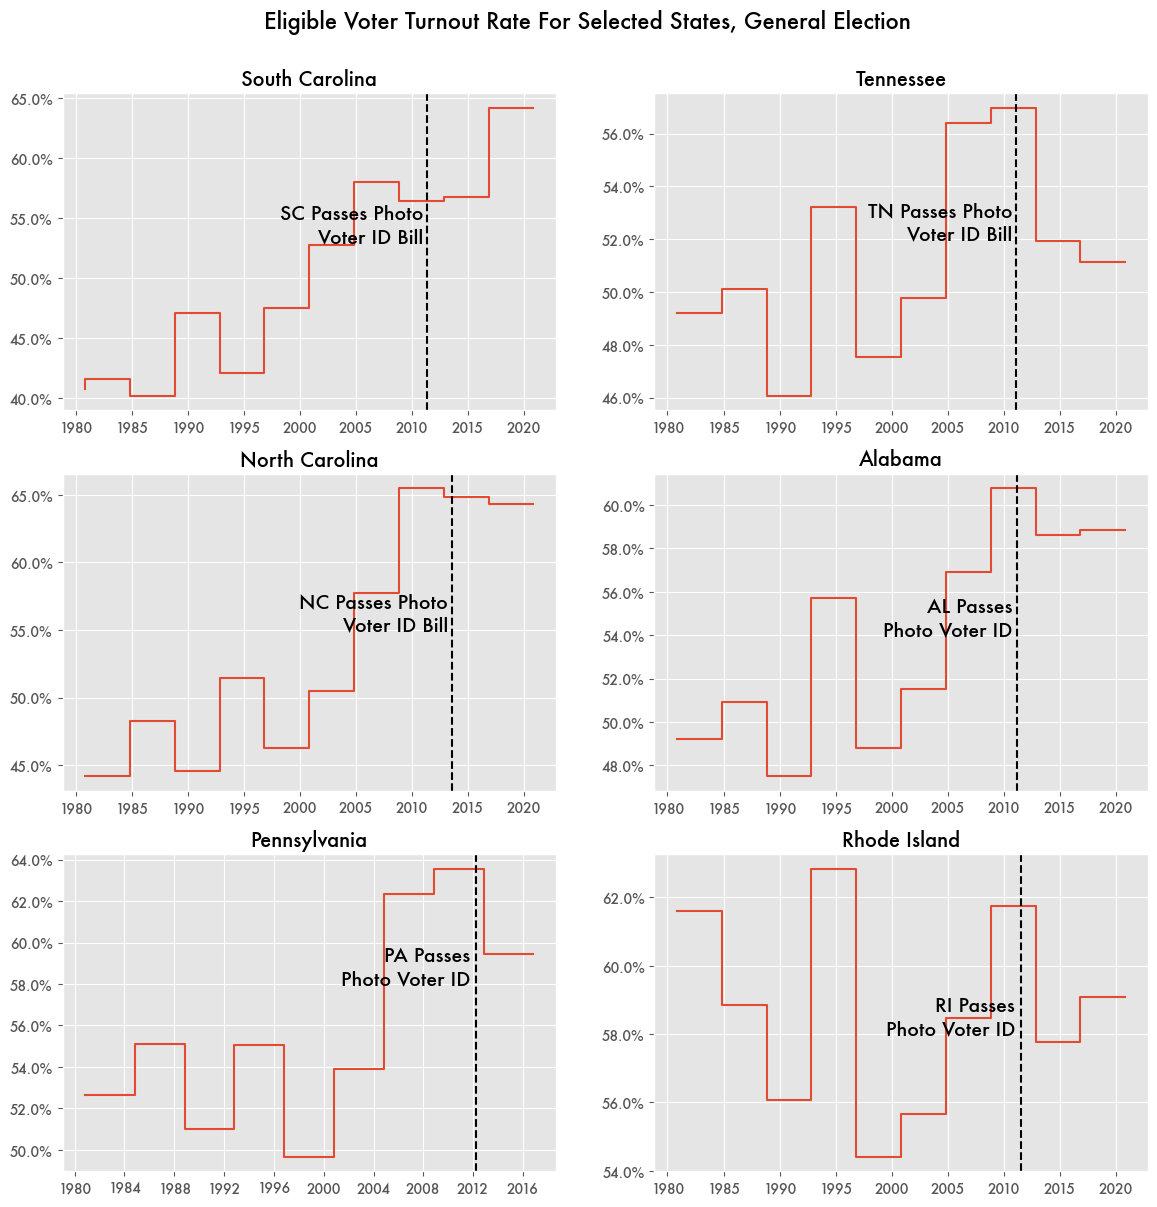
A number of states passed voter ID laws around the same time in 2011, and many of them saw a drop in eligible voter population (VEP) turnout—the number of ballots cast over the number of eligible citizens in that state—for the 2012 general election based on data from the Statistics of the Congressional Election and the University of Florida’s Election Lab.
But so did states like California , Maryland, and Illinois, with nothing close to a voter ID law on the books. Essentially turnout was low across the board in 2012, and having a voter ID law didn’t make much of a difference on top of that. Midterm elections saw a similar trend although it’s complicated by infrequent gubernatorial elections that can skew turnout.
Regressing to the Mean
If that seems odd, also consider that for many of the same states that passed voter ID laws, their turnout rates suddenly fell in line with the national average in a way that seems statistically unlikely.
In prior years, turnout percentage could vary wildly from state to state and election to election. In 1980, it could be in the low 40s for some southern states like South Carolina and Georgia, or it could be over 71 percent in Minnesota. Between the 1988 election and 1992 election, Alaska’s turnout jumped 10 percentage points.
But many states are now almost in exact alignment with the national average, particularly since 2008. States like Alaska, Georgia, Idaho, Illinois, Louisiana, Rhode Island, South Dakota, and Wyoming are now repeatedly within less than 1 percentage point of the national average.
It seems reasonable that voter turnout might become more consistent from state to state over time, but a sudden transformation in one year to being in sync with a national average with such precision appears incredibly anomalous.
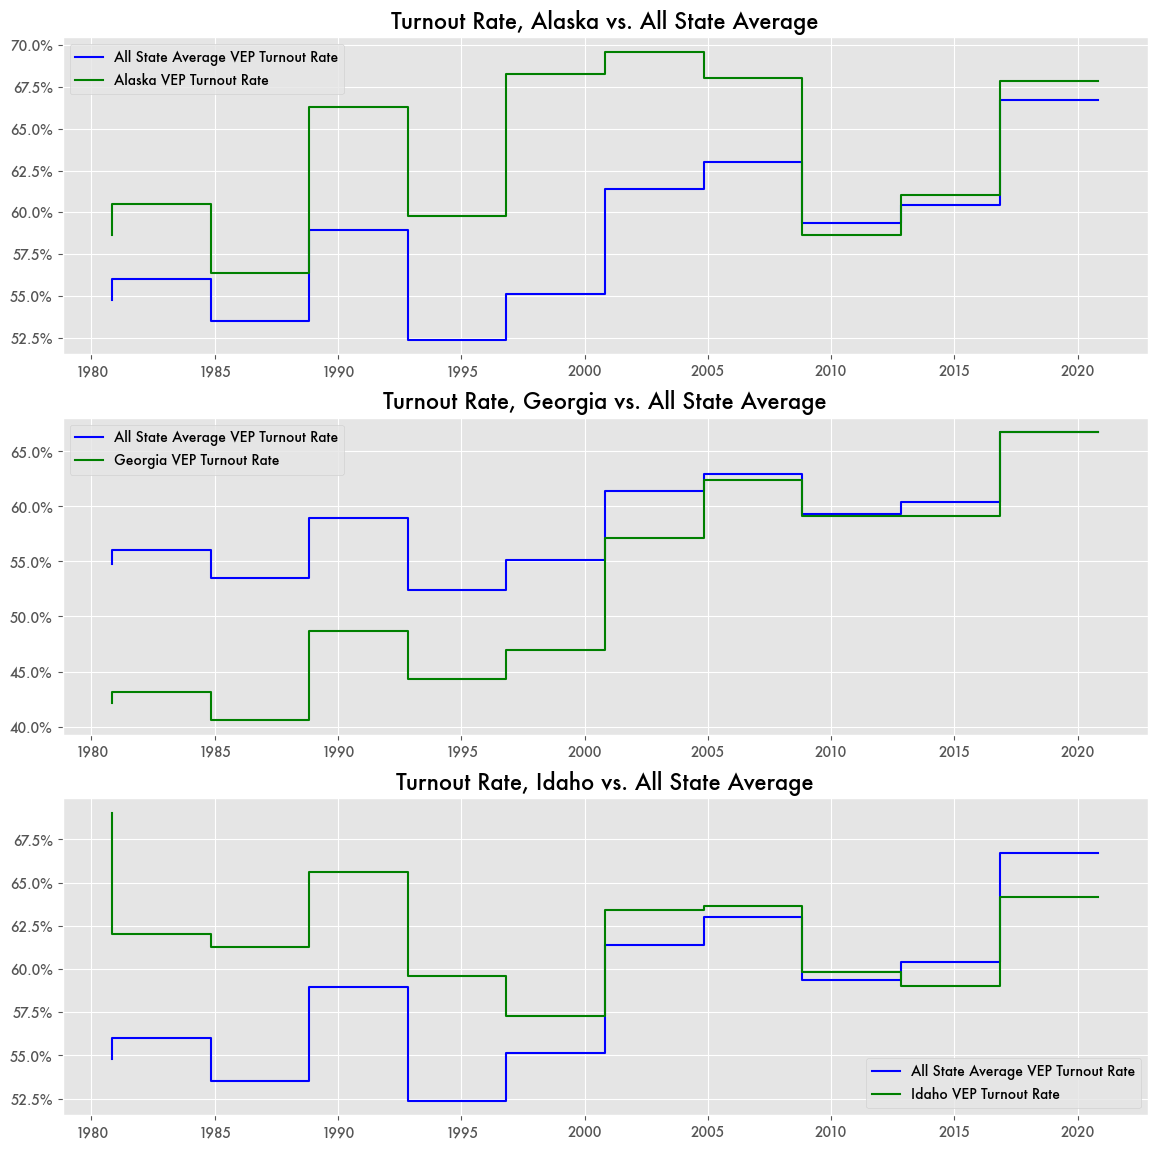
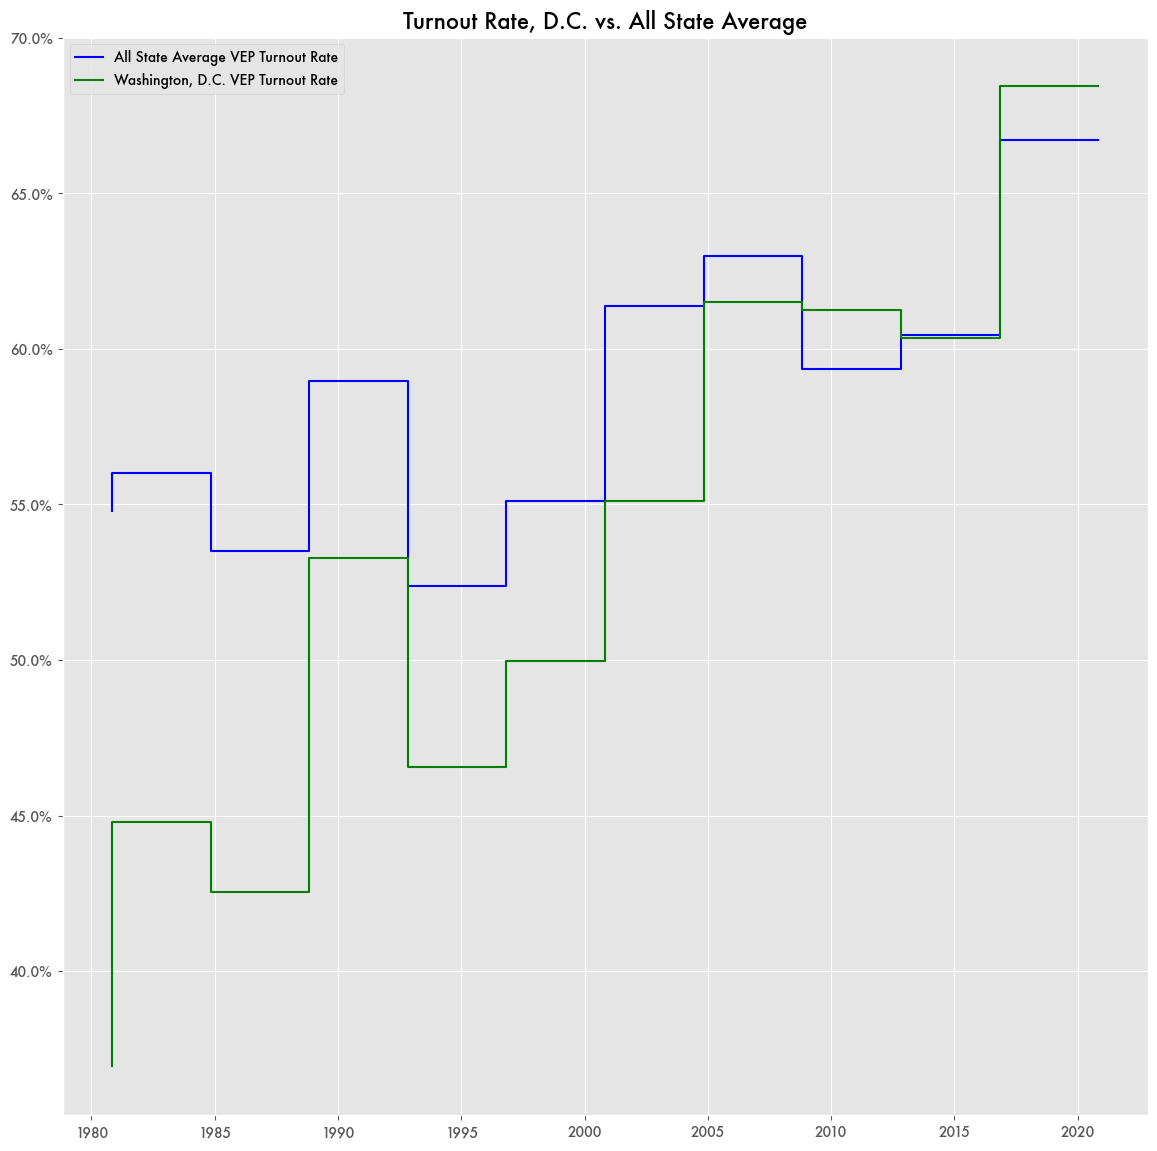
While the states that closely follow the national average happen to have some version of voter ID, some states without voter ID aligned pretty closely as well, like Pennsylvania and Washington, D.C. For D.C., the 2016 turnout rate was within .1 percentage point of the national average. Compare that to 2004 where it was off by over 6 percentage points from the national average.
California’s Counterexample
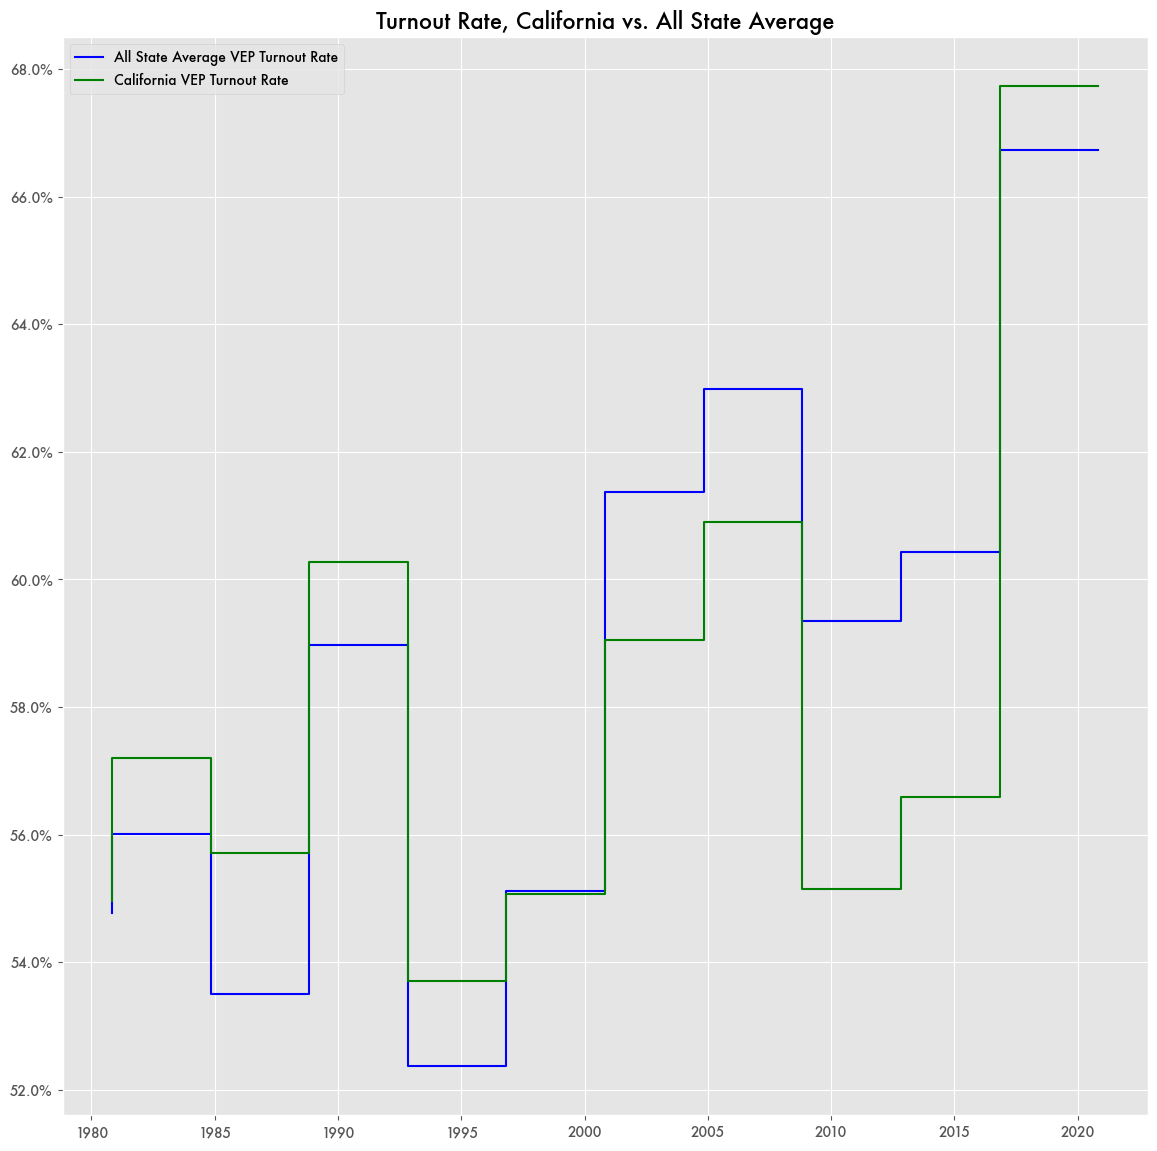
The trend is not in every state as many are like California, where turnout has not regressed to the mean.
California also provides more evidence that other factors may be skewing turnout more than voter ID laws since the Golden State has had a significantly lower rates than the national average in recent years—by 4 to 5 percentage points, except for 2020—despite having no voter ID laws on the books.
Diminishing Variation
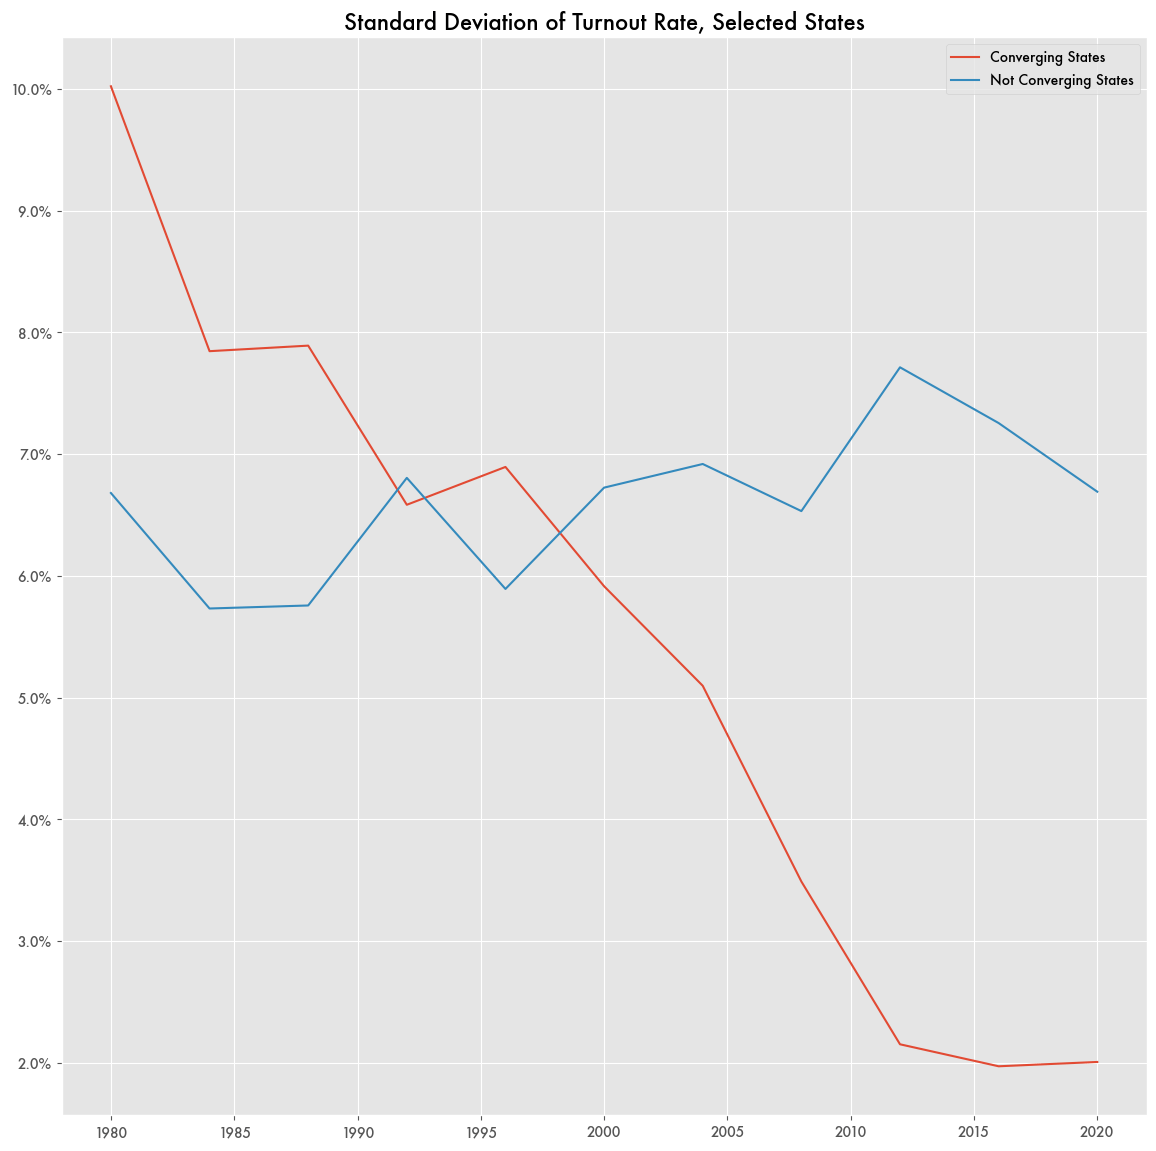
Over the course of a few decades, the standard deviation of turnout rate for those select states has collapsed. Not only are they more in line with the national average, but they are also not varying from election to election anymore.
Ascribing the trend to voter ID seems fraught because the trend doesn’t make much sense. Why a select number of states would have their turnout rates stop varying while others stayed the same is an oddity.