The States Where Electricity Prices Keep Climbing
Starting in 2005, electricity prices for utilities went from around $60 per megawatt-hour to $91 by 2011—a 52 percent increase. The change was unique as prices had barely budged since the early nineties.
At the time, the spike in costs was attributed by the Energy Information Administration (EIA) to growing costs for liquid natural gas (LNG), which was becoming the fuel of choice for power generation.
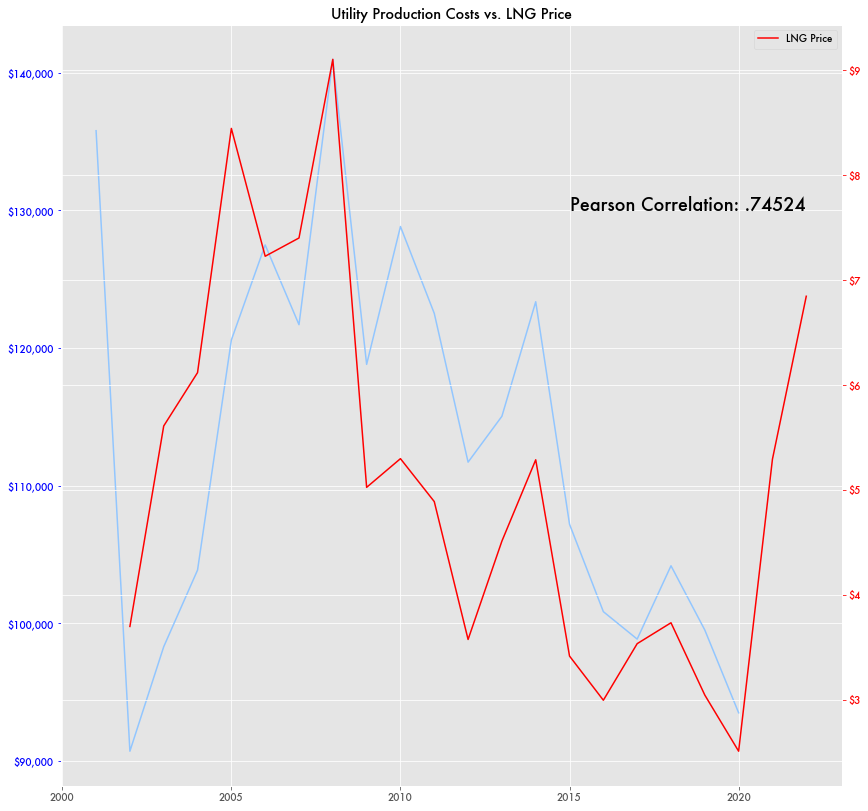
Between 2002 and 2008, LNG prices almost tripled, going from $12.6 per megawatt-hour to $31.1 per megawatt-hour. It wasn’t just the global changes in oil prices. Disruption of natural gas supplies due to a series of hurricanes in the south—Katrina, Rita, and Wilma—helped drive LNG prices for power generators.
But the change in LNG prices was short-lived, and prices have steadily declined since, dropping to a third of what they were in 2008.
Yet, electricity prices in most areas have continued their upward ascent. In general, utilities have reaped the benefits as revenues have grown with fuel expenses declining. For all investor-owned utilities, they earned $20 billion more per year in 2020 than they did in 2001 based on EIA data.
But the picture is different depending on which state you’re looking at. In particular, state-by-state, the change in electricity prices appears to correlate with natural gas production areas. While others, like California, are simply keeping their prices high.
States with little natural gas production and few pipelines to provide it from out of state, like Hawaii, Alaska, and all of New England would see electricity price rates sometimes double.
States with heavy LNG production—Louisiana, Pennsylvania, Texas, Oklahoma—or those right next door to production—Arkansas (next to Louisiana), New Mexico (next to West Texas)—would see price growth below inflation and below the U.S. average.
Investigative Economics previously covered how California has seen prices far beyond those seen during the days of the Enron scandal. Over the same time period, California has pushed for a heavy reliance on renewable energy—largely wind and solar—and shut down other sources of generation. Up until recently, the Diablo Canyon nuclear facility was set to be shut down, but that was put on hold this year when the state extended the plant $1.4 billion in taxpayer-funded loans.
Yet while California has been highlighted for potential generation constraints, fuel costs aren’t driving electricity prices.
The California state utility, Pacific Gas and Electric (PG&E), noted in their annual report that changes in natural gas prices led to savings of $799 million on fuel purchases in 2009. And that was when the utility’s average cost for gas was $4.47 per thousand cubic feet. Annual reports for last six years put the average price paid by the utility at just over $2.
While fuel costs have gone down, the utility suffered huge financial setbacks from the various fires in California from 2015 to 2018 that were attributed to PG&E’s transmission lines. The utility has since had to file for bankruptcy.
Massachusetts also pays some of the nation’s highest prices for electricity after shutting down various sources of generation, including the Pilgrim nuclear plant. The lack of LNG pipelines in New England during a cold snap in 2018 meant that Massachusetts relied on imported LNG from Russia despite the U.S. being one the largest producers of natural gas.
But it’s not clear what’s driving Massachusetts’ electricity prices. One of the major utilities for Massachusetts and other New England states, Eversource, lists total amounts paid per year for natural gas going down by about $223 million between 2011 and 2019 in annual reports. But total spending on purchased power and operation has gone up by about $1 billion a year in that time.
East coast states like New York and New Jersey pay high rates despite being close to the Marcellus shale—one of the largest natural gas development areas in the country that includes Pennsylvania, West Virginia, and part of other surrounding states.
But New York state has a de facto ban on fracking and limited pipeline infrastructure connecting it to the Marcellus shale. Similarly, New Jersey has hit regulatory barriers attempting to approve the PennEast pipeline to import natural gas from Pennsylvania.
Other potential pipelines have faced opposition from environmental groups, including the Mountain Valley Pipeline, Atlantic Coast pipeline. The Keystone pipeline was cancelled in 2021 after President Biden canceled its permit.
A 2016 list from ThinkEnergy lists 28 LNG pipeline projects that were either cancelled, rejected or delayed over the last two decades.
Utility Expenses
While LNG prices and electricity prices diverged, the expenses reported by utility operators continues to align with LNG prices. As LNG prices declined, so have utility production costs.
Other Costs
While fuel costs are going down, other costs have increased. Transmission costs have quadrupled, going from about 1 percent of total expenses to 5 percent since 2000.
According to the ISO for the MidAtlantic, PJM, transmission costs accounted for 25.7 percent of costs in 2021.
According to a white paper from the University of Texas’ Energy Institute, a larger driver of growing transmission costs are things related to connecting new generators into the grid, like spur line , point-of-interconnection, and bulk transmission expansion costs.
While generation from natural gas and renewables have been joining the grid for the past 20 years, the pace has quickened for renewables since 2011 when the Recovery Act injected about $90 billion in to renewable energy investments.
Depreciation Costs
While depreciation is not an immediate expense—otherwise known as a non-cash charge—it is now a larger share of operator expenses in their accounting, representing over 15 percent of the total—a difference of $20 billion for all investor-owned utilities since 2000.
Depreciation has grown despite there being fewer investor-owned utilities that might be listing it on their books. In 2004 there were 242. But by 2019 there were only 202.
Renewables and Energy Prices
While natural gas appears to be driving electricity prices, renewables regularly get blamed for undermining prices. That is, because of subsidies and tax credits, renewable energy producers are able to underbid and skew markets to prices lower than they should be. Sometimes they can even make negative bids—offering to pay to provide electricity.
But wholesale electricity market data from EIA shows few examples of that. There are only 11 days in the data going back to 2014 when negative bids occurred as the lowest price offered that day.
In general, even the lowest bids for electricity follow natural gas prices as well, showing little skew from renewables year-to-year. The one exception would be 2021 when gas prices spiked following the Russia-Ukraine war and the average spread between highest and lowest price doubled.
While government subsidies for renewables have been significant at times, the lower cost for renewables has largely come from the technology getting cheaper and cheaper.
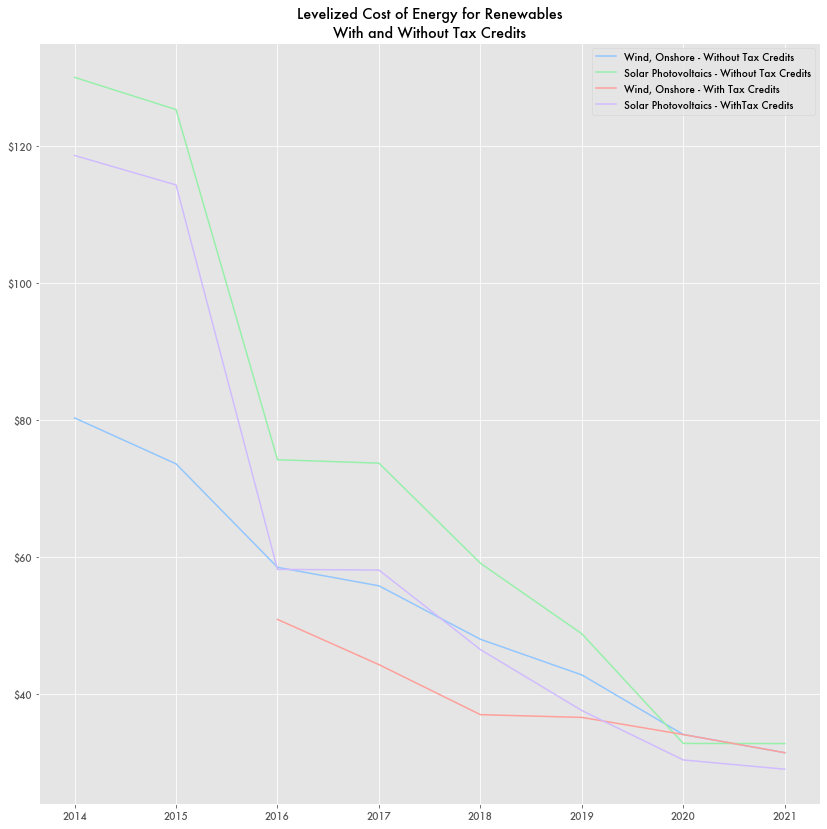
According to EIA reports, the levelized cost of electricity (LCOE)—the estimated average cost to generate electricity including all operating expenditures—for renewables—specifically solar photovoltaics and onshore wind—has collapsed over the last decade. This includes with and without tax credits such as the Production Tax Credit (PTC) often used for wind farms.
The EIA’s 2021 report notes that LCOE for these energy sources have declined “through lower capital costs or improved performance (as measured by capacity factor for onshore wind or solar PV plants), offsetting some or all of the loss of the tax credits.” The National Renewable Energy Laboratory estimates that wind production costs will continue to decline in the following years.
As a result, renewable costs, even without tax credits, are significantly cheaper than other standard baseload generation fuels like coal, gas, and nuclear.
Spread Between Renewables and Capacity-Weighted Natural Gas
With renewables getting cheaper and natural gas getting cheaper, the spread in LCOE between the two is not that big. For onshore wind and natural gas, wind is cheaper by $4.21 per megawatt-hour.
But that’s for the average price of natural gas. Maximum prices for coal and combined cycle natural gas units can hit $100 a megawatt-hour. For combustion turbine natural gas generators, something used to meet peak demand, it’s on the order of $123-$145 a megawatt-hour.
Maximum LCOE for onshore wind top out at $65 a megawatt-hour. The difference between the two could be as high as $80.
EIA notes that some operators take advantage of this spread, not by bidding in the wholesale markets, but through power purchase agreements (PPA):
…the wind purchaser will schedule the wind energy into the market, paying the wind project owner the pre-negotiated PPA price but earning revenue from the prevailing wholesale market price.
Capacity Pricing
A number of regional transmission operators (RTO) now operate forward capacity markets—bidding markets for future energy supply rather than more immediate need—to help offset price spikes. Generators can be fined if they are unable to produce energy for the time period they won a bid on.
The capacity markets were largely put in place to help compensate for the growing reliability and resiliency concerns following high-profile disruptions to the grid over the last twenty-plus years: from the Enron crisis to hurricanes in the Gulf.
During the Enron crisis in California, some generators were found to be intentionally shutting down to create more scarcity and drive prices higher. Over the last twenty years and in response to the Enron crisis, the Federal Energy Regulatory Committee (FERC) has put an additional effort on prosecuting energy market manipulation, with high-profile cases against banks like J.P. Morgan and Morgan Stanley.
In the mid- to late 1990s, many states deregulated their electric industries in an effort to lower prices through free-market competition. Environmental groups supported deregulation as a way to enable access to the grid for renewable power.
But the introduction of renewable energy on the grid has been a complicating factor. Because of its intermittency—inconsistency in times of low wind and low sun and high demand—renewable energy has lead to more dependance on natural gas. Renewable providers may not be able to predict when they have power available and can miss out on bids.
Yet despite LNG prices being cheap, prices at times of peak demand can be exponentially higher because of its “just-in-time” requirements—it needs to be contracted ahead of time because excess capacity of LNG can’t be stored on site like other fuels such as coal, nuclear, or petroleum.
While natural gas prices have fallen over the last decade, natural gas prices in spot markets for electricity can spike by 1,000 percent at a time of need.
To compensate for all of these potential holes in capacity, ISOs have implemented different variations of fees, subsidies, and bidding markets like uplift costs, forced outage rate payments, and capacity markets.


