The Statistical Insignificance of Monthly Job Reports
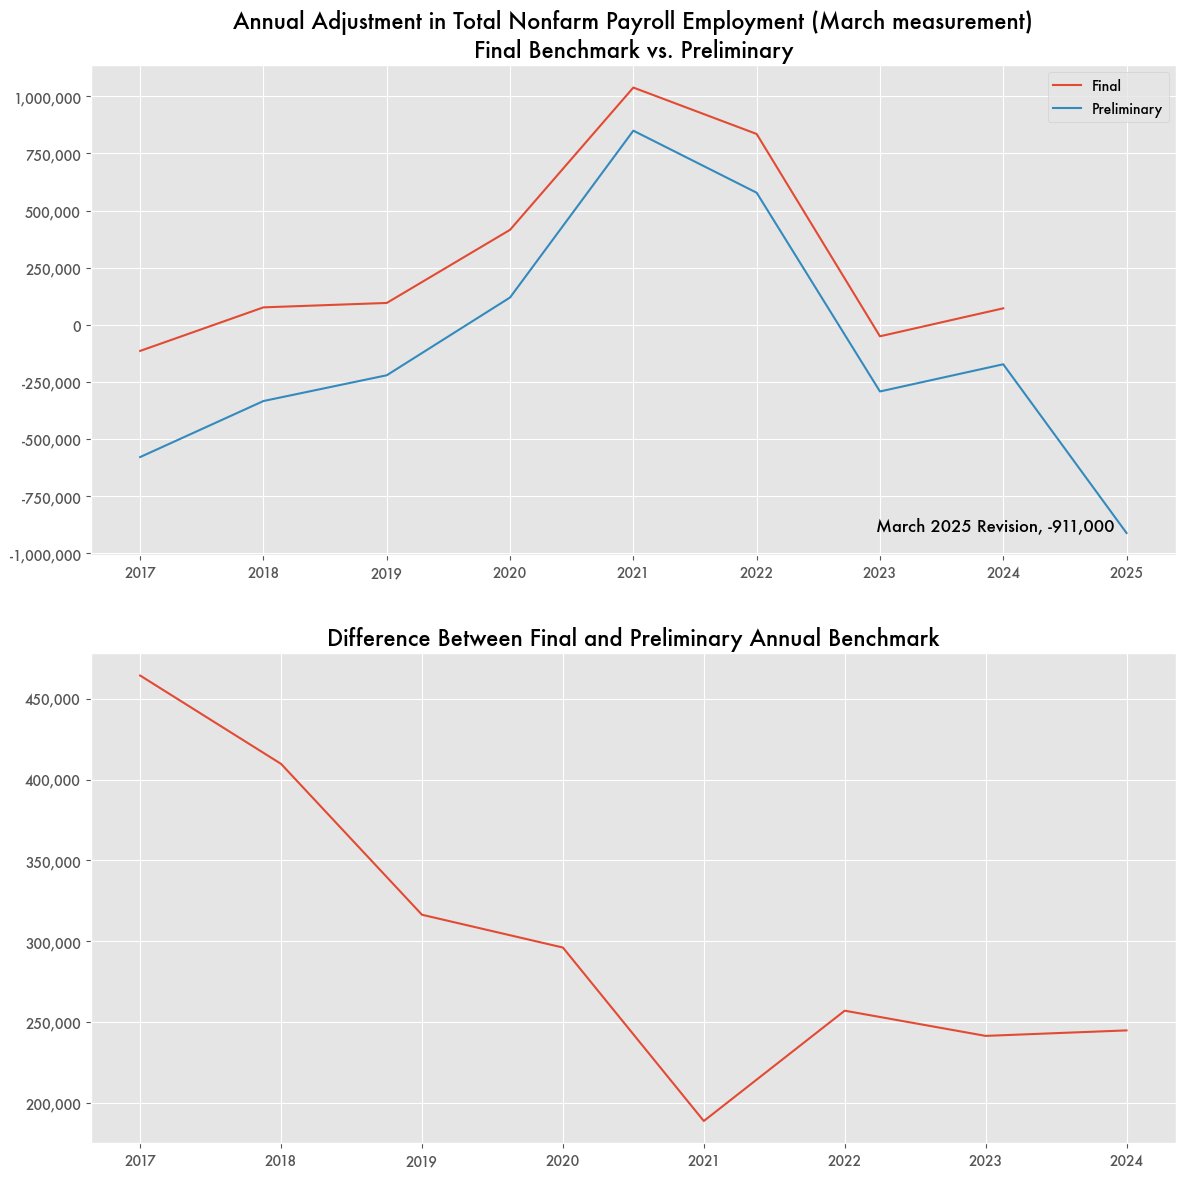
In March of this year, the Bureau of Labor Statistics (BLS) published the preliminary revision to its annual estimate of total employment equal to -991,000 jobs—the largest revision on record.
The benchmark revisions are essentially a gauge of how accurate BLS’ labor estimates and forecasts can be and what that can mean for the economy. A glaringly inaccurate estimate might mean their understanding of the economy was deeply flawed or something else.
The jobs report is regularly regarded as the barometer for the economy, and a good jobs report usually triggers a stock market bump. Its influence is so strong that the forecast is kept strictly confidential. Preliminary access would give any investor an unfair market edge, and any adjustment is met with derision that the system is rigged.
Yet there have been major revisions in the past. In 2021 it was originally revised upwards by 849,400 and in 2017 it was originally revised downward by 578,700. Even if the annual estimates were precise, month-to-month variations can often be particularly volatile and unreliable for economic insight.
Currently, because of the government shutdown, the jobs report has not been released since September.
Wildly Varying Monthly Adjustments
BLS job estimates are based on two separate surveys: the establishment or payroll survey (Current Employment Statistics or CES) and the household survey (Current Population Survey or CPS).
The establishment survey is the more accurate one but doesn’t include a lot of jobs from self-employment and new establishments, which is why the household survey is used to annually augment the establishment survey, leading to the final benchmark adjustment.
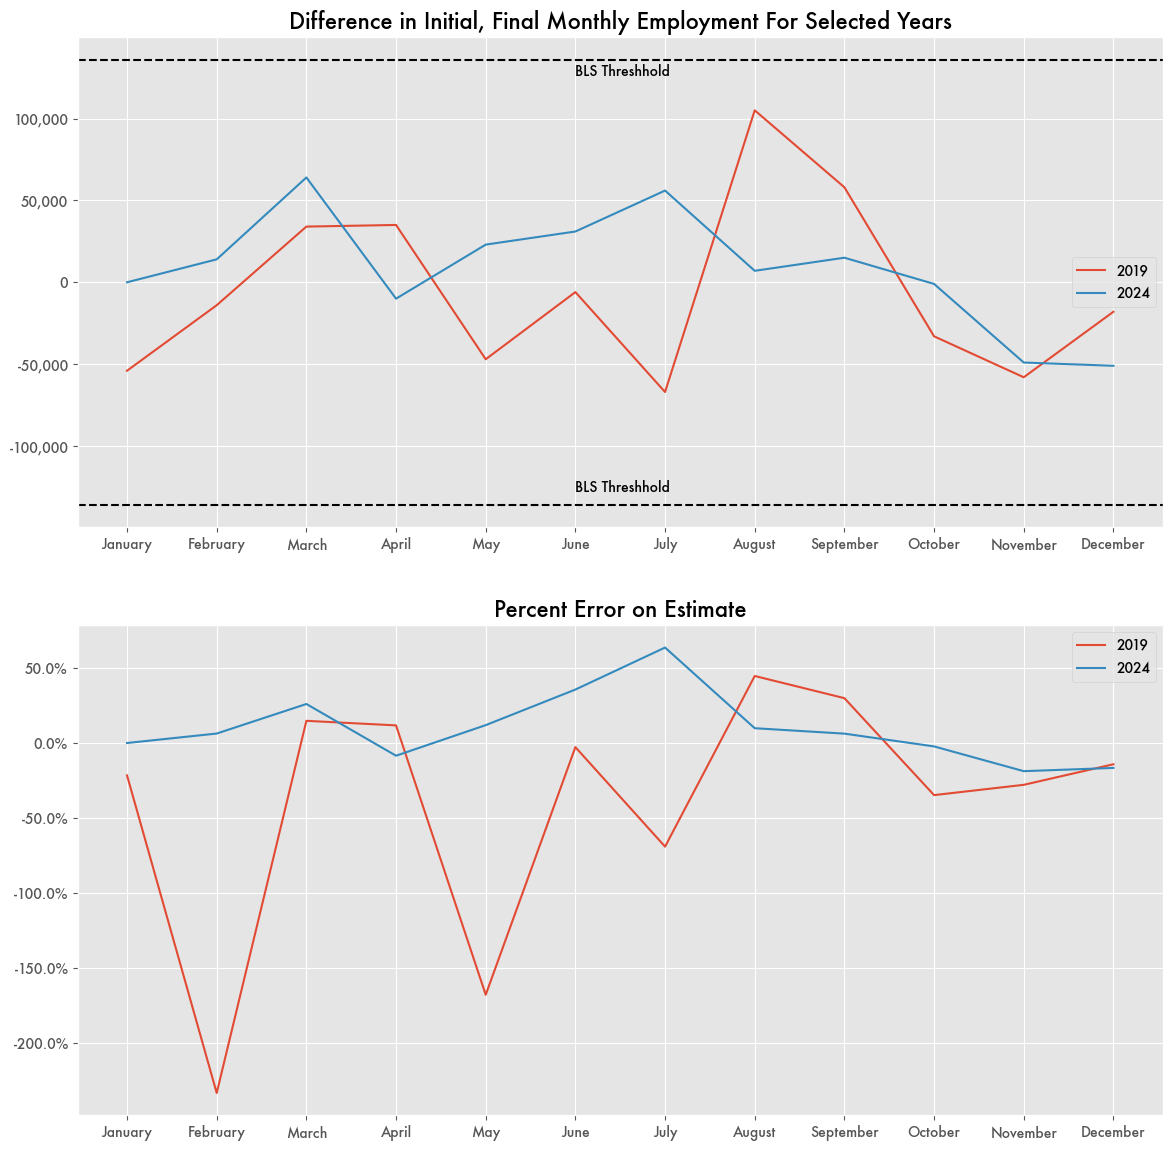
For the establishment survey, an error of 136,000 is considered statistically significant. And the difference between what is originally announced by the BLS through its Employment Situation press release and its final estimate from statistical collections are consistently within that error threshold.
But that error threshold is incredibly wide considering that the median monthly change in employment since 2019 is around 239,000, so an error of 50 percent would be considered within reason.
At certain times the monthly estimate is so accurate its uncanny. In October and August of 2024, their estimate was within 10,000—a percentage error of less than 10 percent.
But then there was July of 2024 when it was revised downward by 69 percent—97,000 jobs were added not 164,000, a downward revision of -67,000. In August of 2019, it was revised upwards by 105,000 (45 percent error). In May, what was anticipated to be 75,000 jobs was only 28,000.
There are also other examples where estimates go far beyond the expected range, like at the beginning of the pandemic. In March of 2020, BLS noted a 701,000 drop in total nonfarm employment. Currently their establishment survey statistics show a drop of 1.4 million—double the original estimate.
For the large drop in March of 2025, BLS lists it as only a .6 percent adjustment to the total. But that’s misleading as it should be compared to the year over year change in employment, not the total. Otherwise the BLS could improve their estimates just by assuming the same number every year.
Volatile Monthly Reports Mean Little
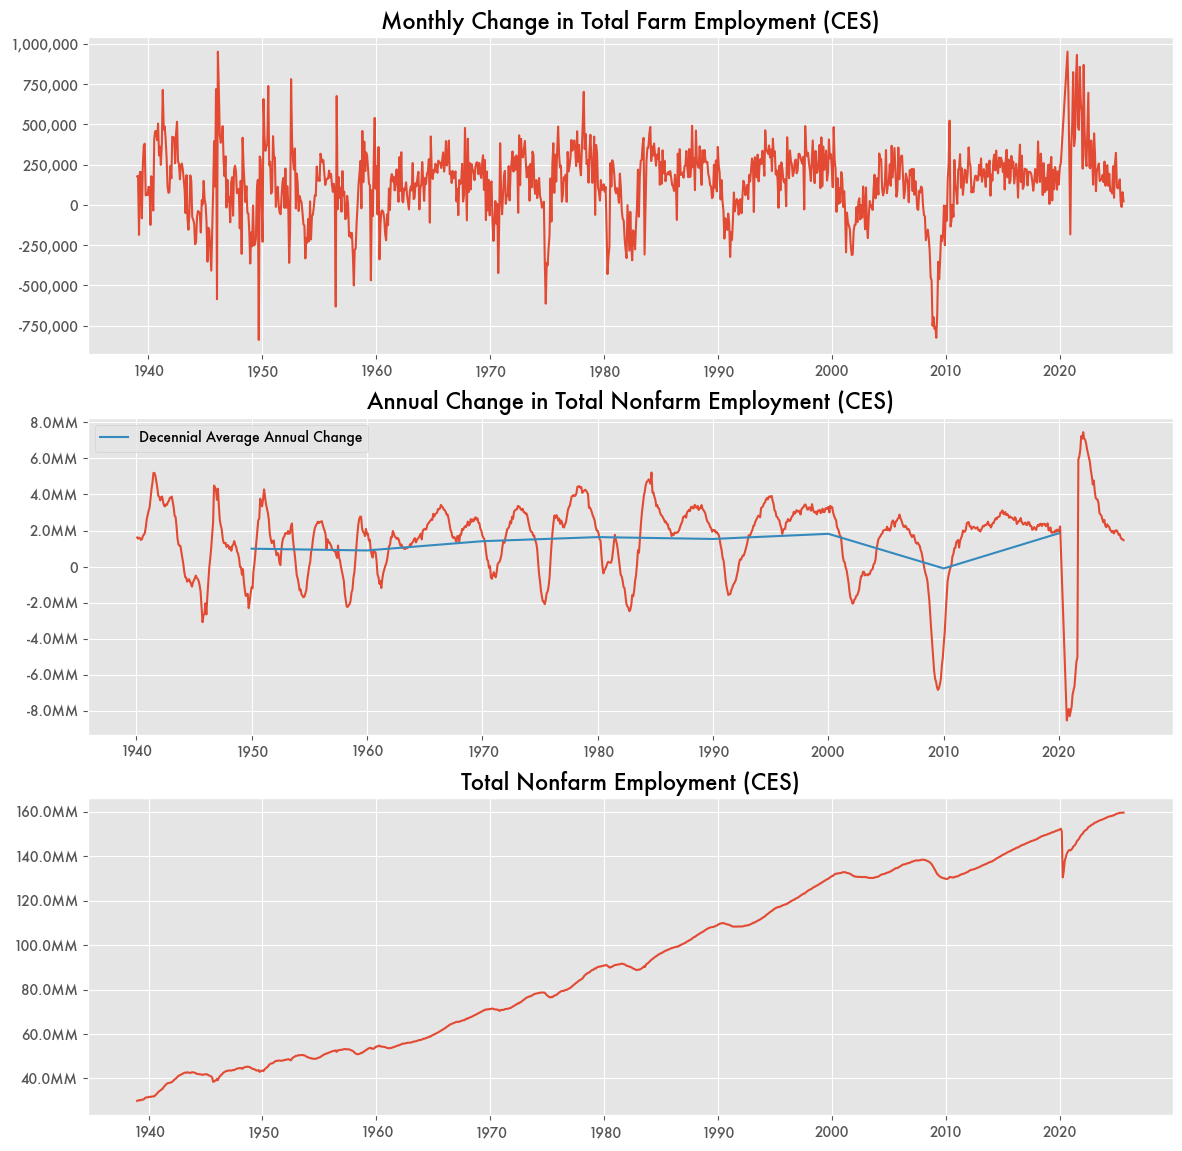
To their credit, accurate measurement of the jobs total is likely fraught as its consistently volatile (standard deviation: 702,000). Job numbers frequently oscillate back and forth month to month whether or not its a recession or a recovery or neither.
While three straight months of job losses is a consistent indicator of a recession under the Sahm Rule, that’s based on the moving average to ignore some of the volatility. And there’s a lot of other situations where a month’s estimate isn’t a helpful indicator of anything. There can be multiple months where no jobs are added in the midst of an economic boom, like the late nineties. For example, in August of 1997 the economy lost 28,000 jobs, but across all of 1997 it gained 3.7 million.
In general, whether or not the total number of jobs went up or down one month and whether the BLS predicted it within range doesn’t mean much as the total number of jobs has kept an even keel for decades no matter what—up until the 2000s.
Scaling out even further, the volatility in job creation becomes almost negligible across decades as the average annual increase in employment for decades barely budged. Between 1970 and 2000, the economy consistently added around 1.6 million jobs a year independent of recessions or fuel crises. It wasn’t until the 2000s that the trend would stop and there would be regular declines in employment.