What MoneyBall? For Most Baseball Seasons and Teams, Team Payroll Has Little Effect on Winning
The book Moneyball, published in 2003 by Michael Lewis and the movie of the same name, detailed how baseball had become purely a game of dollars. With enough money, a team could buy their way to winning seasons using sabermetrics—advanced baseball analytics that can determine the best players a team can buy, “saber” being a reference to the Society for American baseball Research (SABR).
Certain teams, like the Athletics under general manager Billy Beane and the Tampa Bay Rays, had perfected the techniques, and the money-trained tactics had already proliferated the majority of the league turning the sport into simply a game of dollars.
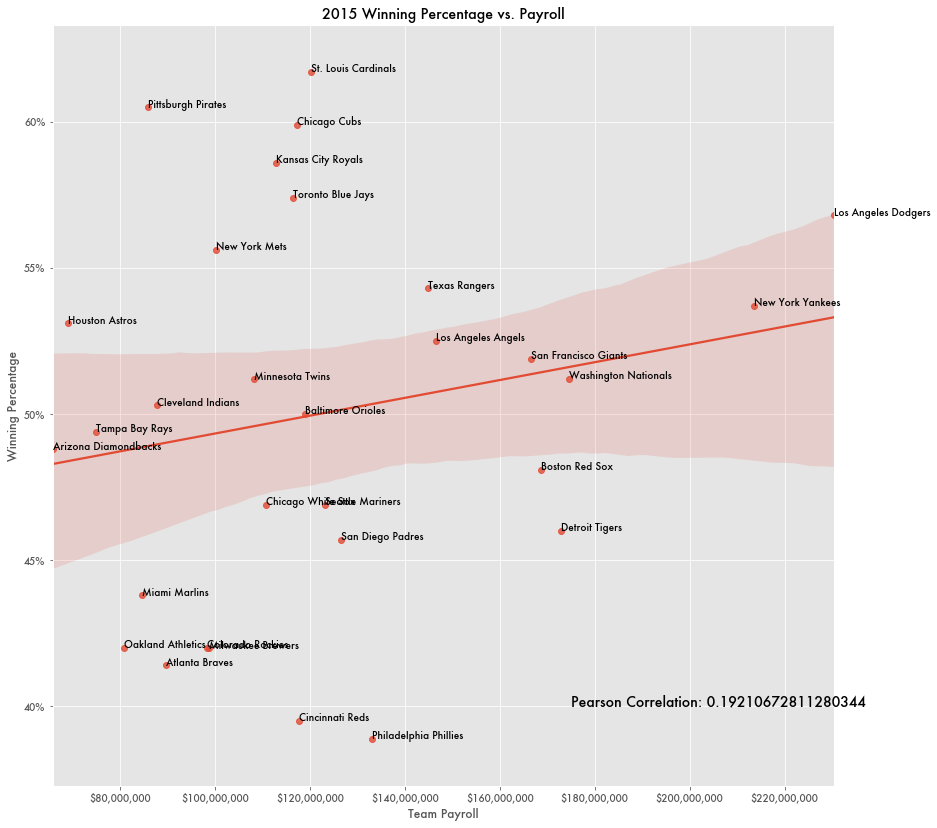
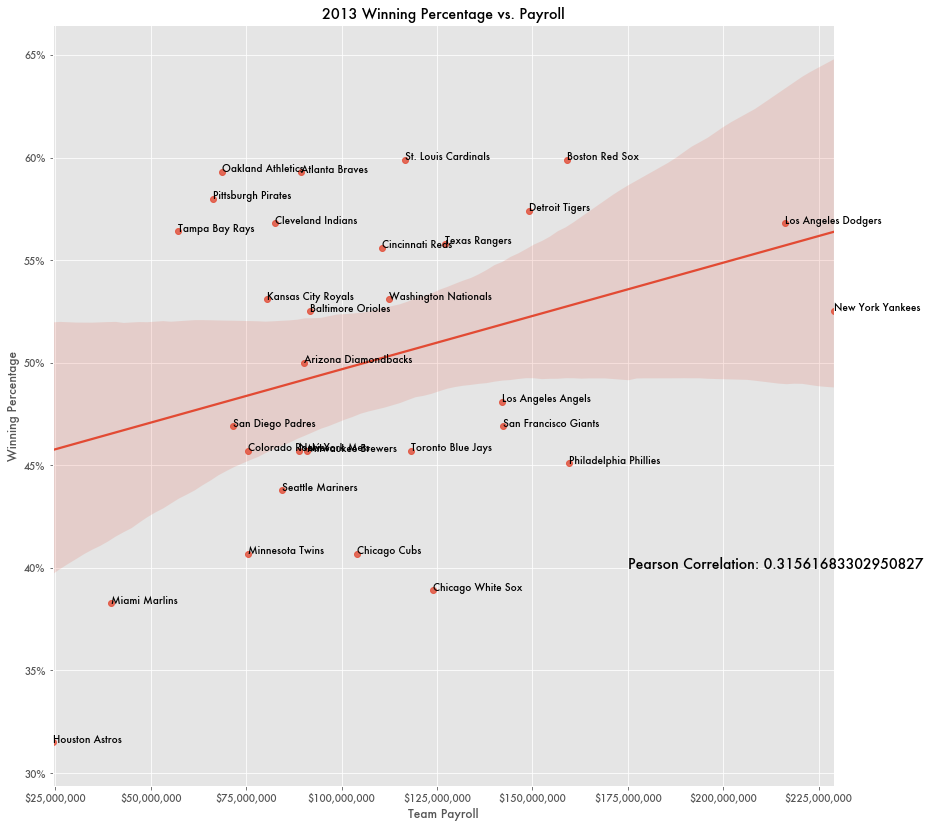
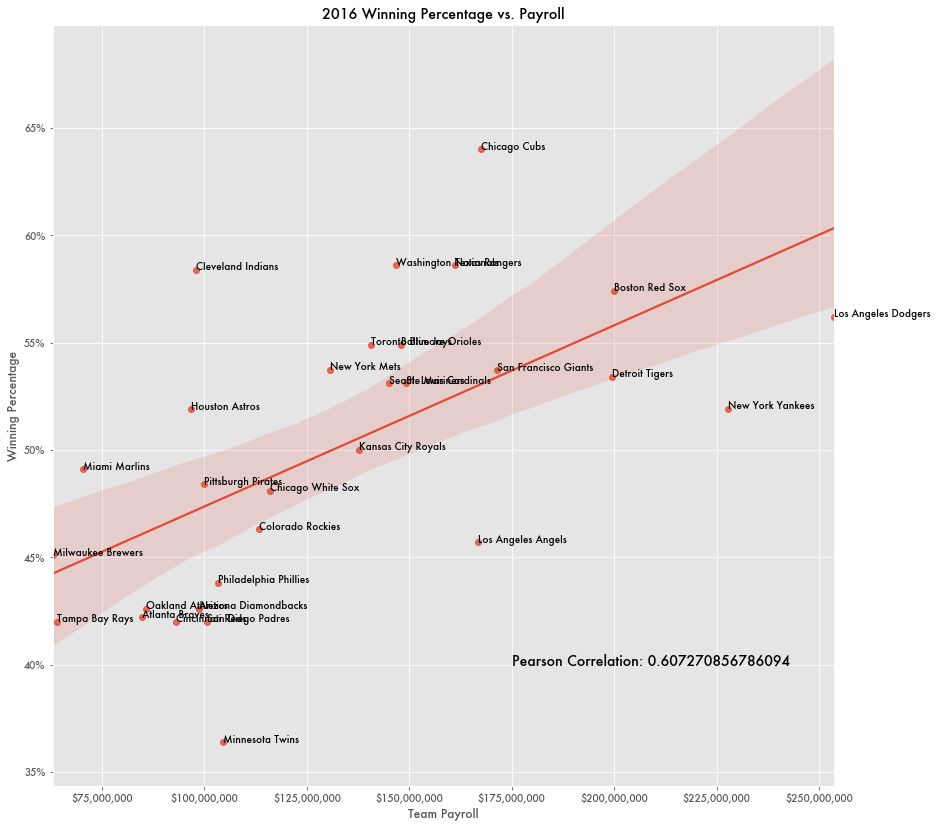
Yet money doesn't consistently mean more wins. Data from The Baseball Cube since 2010 shows that for each team, more money spent on team payroll does not correlate with win percentages.
For most years during that period, Pearson correlation values between team payroll and win percentages never get above .5, with p values consistently above .05. A substantial correlation would be a value above .8 with p < .05. In 2015, the correlation value was .10.
Only in 2016 did a substantial correlation between spending and wins exist (Pearson: .65).
A higher correlation exists between attendance and winning percentage based on attendance numbers from ESPN (Pearson: .48) than for winning percentage vs. payroll (Pearson: .30), or .33 when adjusted for annual MLB payroll averages. Although attendance, unlike payroll, is not largely decided at the beginning of the season and can be a consequence of a winning season.
On average, teams that spent more tended to win more games, but the lack of a correlation and the wide breadth of counterexamples implies that it is a weaker factor than previously thought.
For example, the 2019 the Chicago Cubs had the second highest payroll with $210 million yet were only third in their division and didn't make it to the playoffs. The Red Sox spent the most that year and only came in third in their division—although they did make it to the playoffs as a wild card. The 2019 Atlanta Braves won the World Series despite spending a middling $113 million on payroll that year.
In 2015, the Houston Astros and the New York Yankees had similar winning percentages, but the Yankees spent around $40 million more on their players that year.
The Tampa Bay Rays and the Oakland Athletics—the subject of Moneyball—still stand out for the lowest average ratio of payroll to win percentage—they get the most out of what they spend—with others like the Pittsburgh Pirates and Cleveland Indians behind them.
Teams from larger cities like The New York Yankees, Boston Red Sox, Detroit Tigers, and the Los Angeles Dodgers and Angels ranked at the bottom of payroll efficiency, spending the most per win. But that is most likely a result of those teams simply having more money to spend, and payroll highly correlates with payroll-to-win percentage (Pearson: .9).
For Some Teams, Money Does Make a Difference
When looking at correlations by team, certain teams appear to have a substantial connection to payroll, while others have an inverse connection.
The Houston Astros appear to win more with more money, but the San Francisco Giants and the Yankees lose more with every dollar they spend, although most teams have a weak correlation.


